This page collects together all relevant information on the ULTRASPEC EMCCD detector.
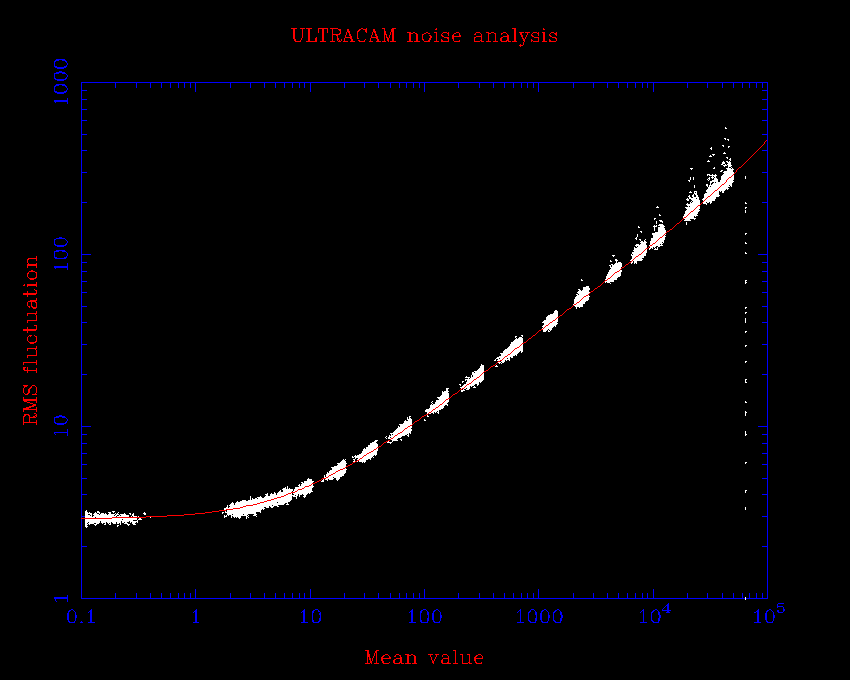
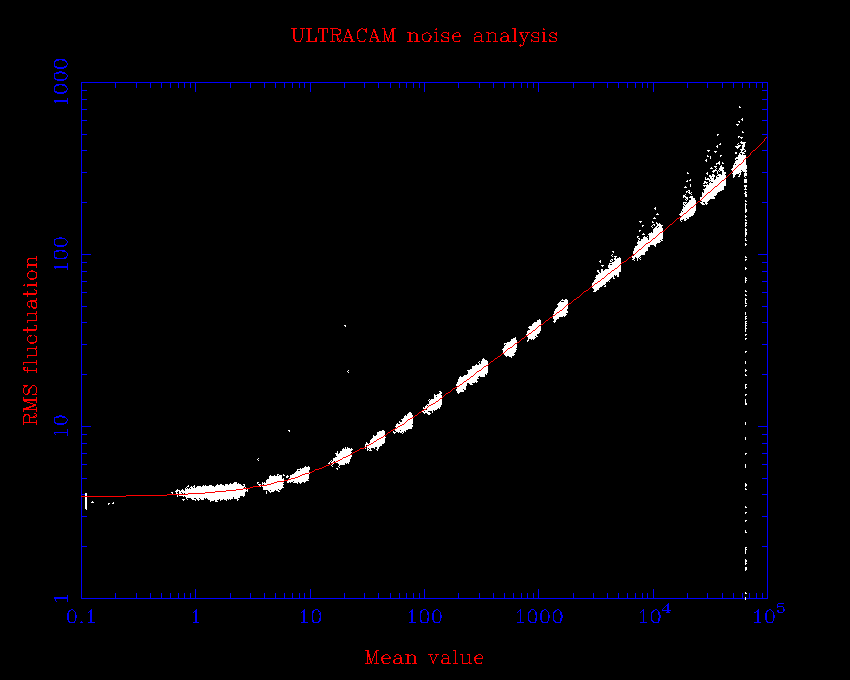
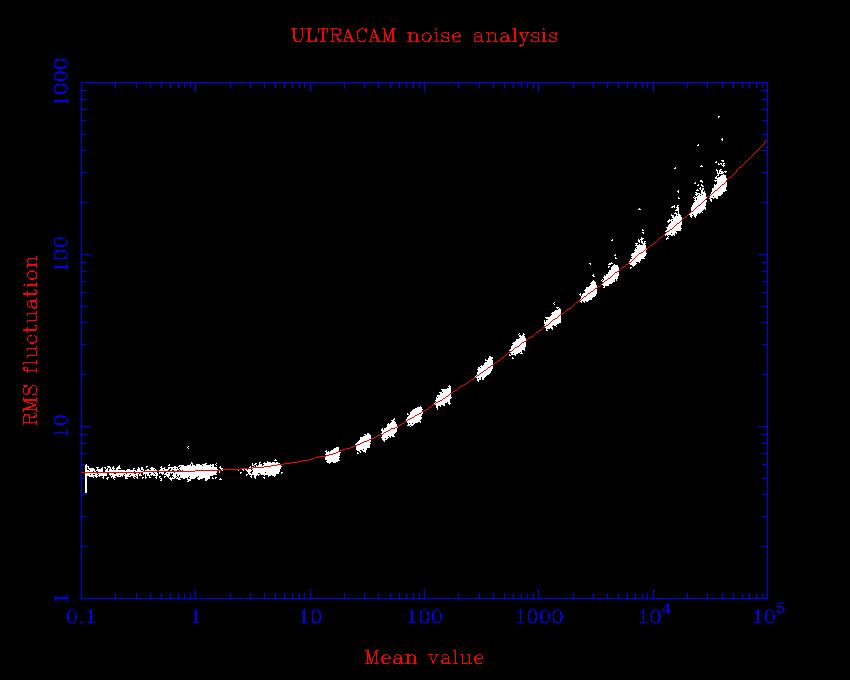
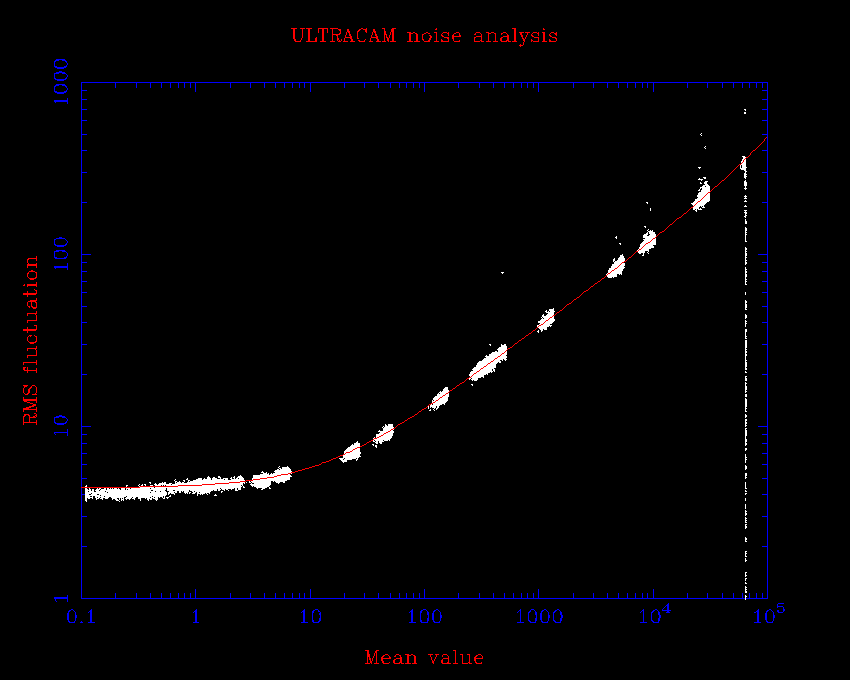
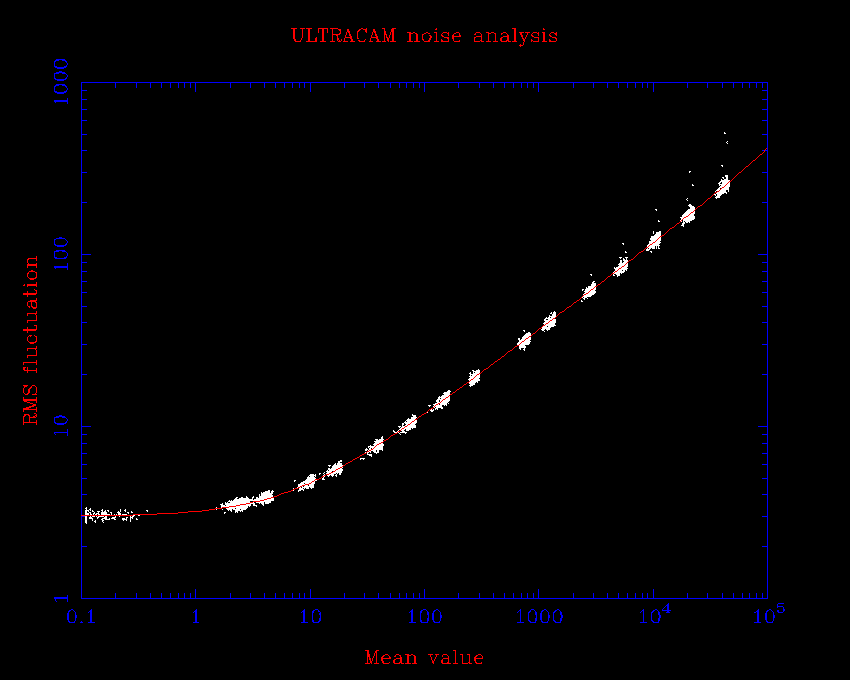
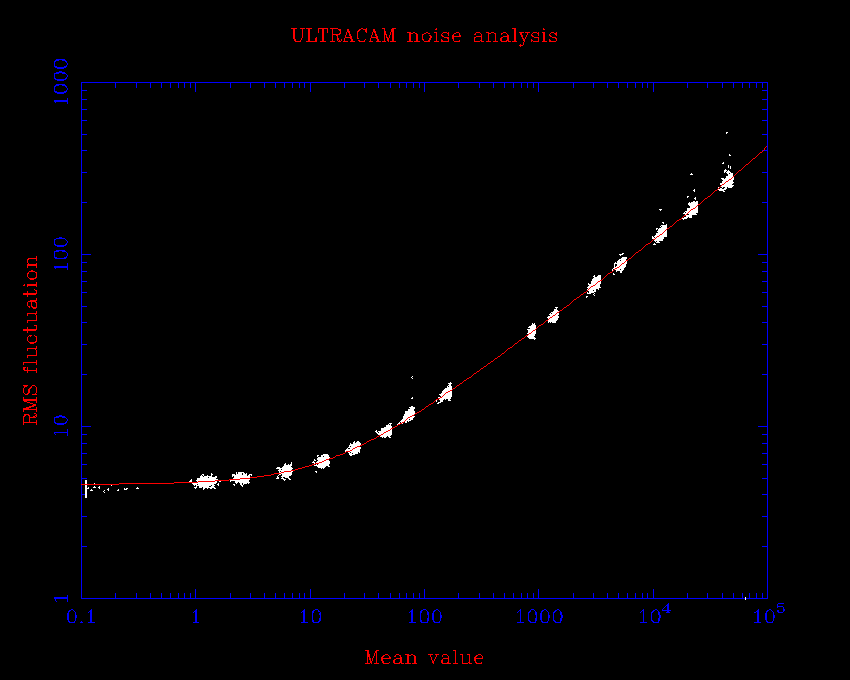
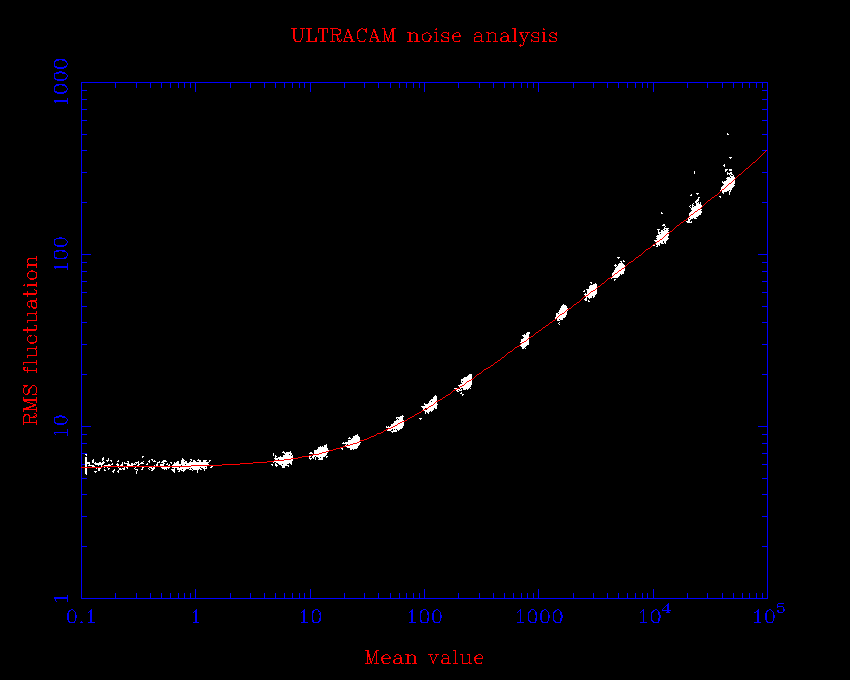
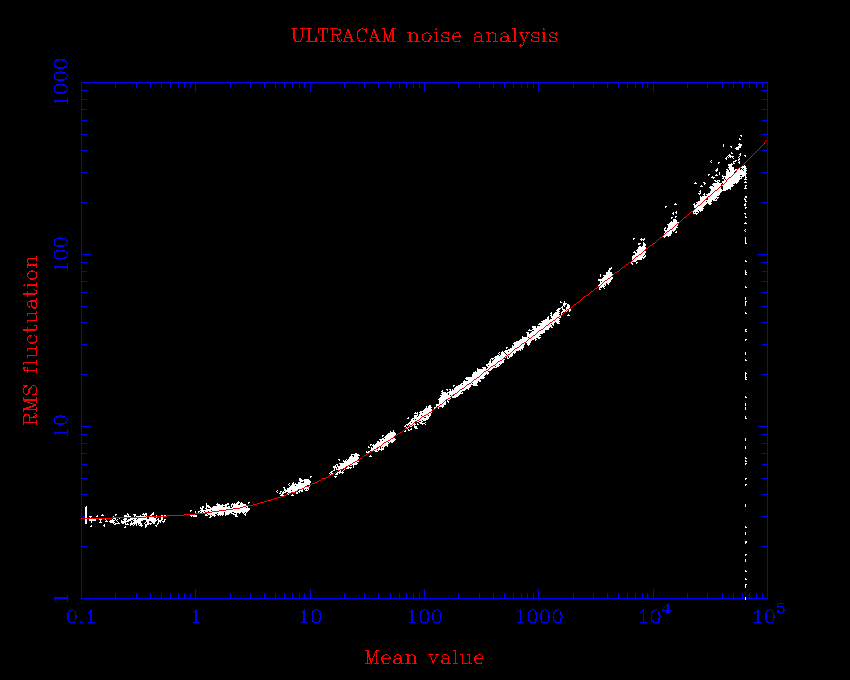
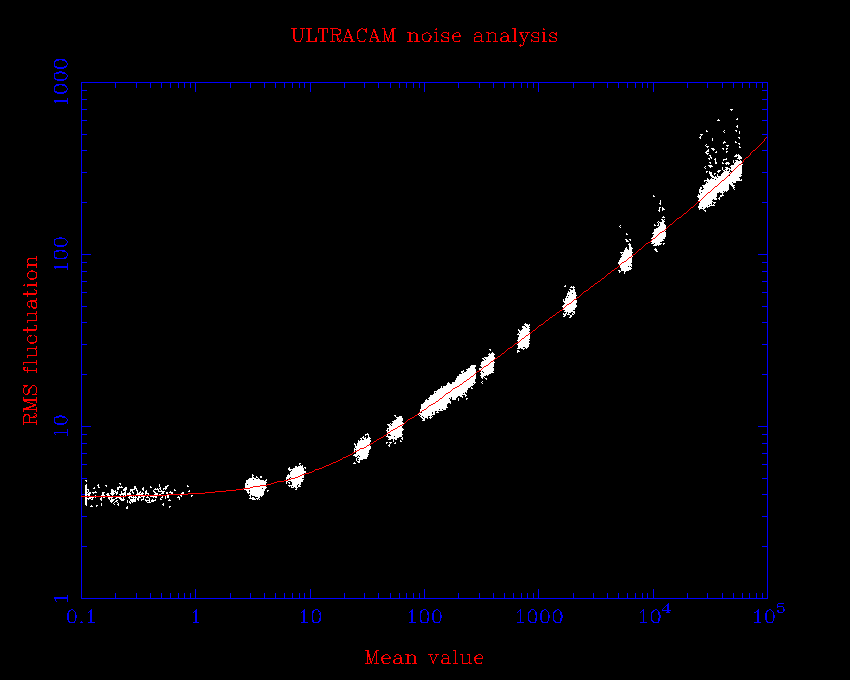
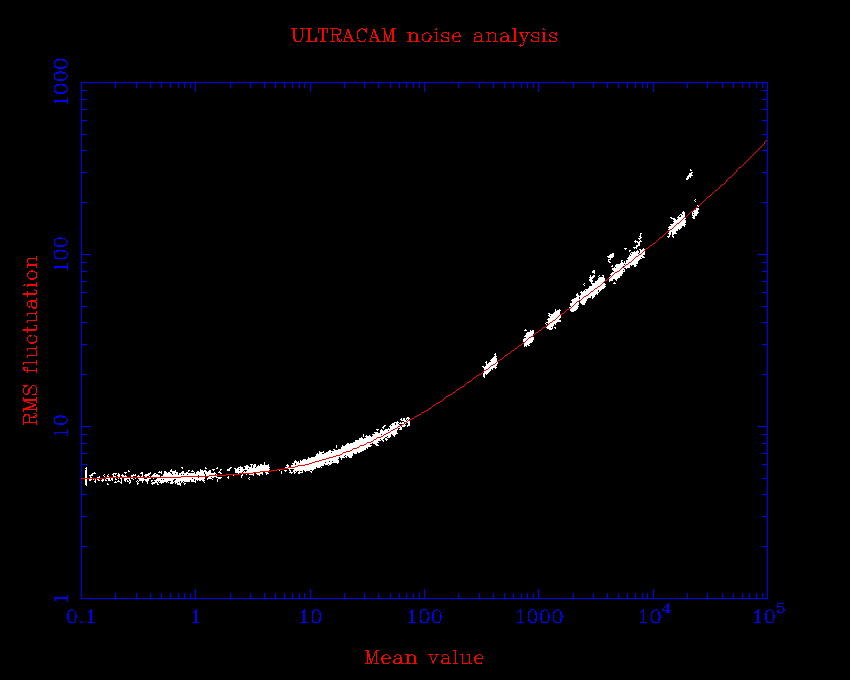
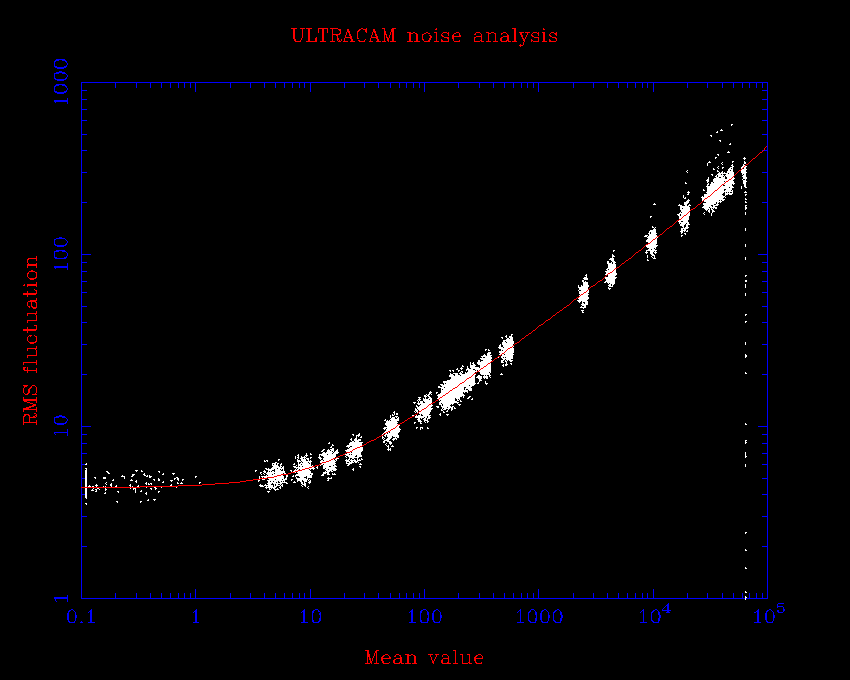
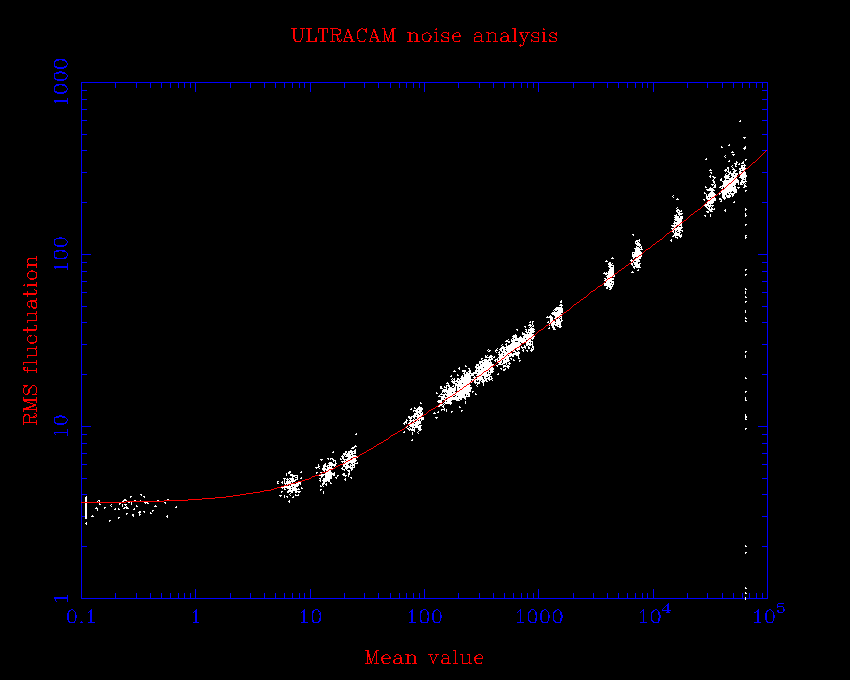
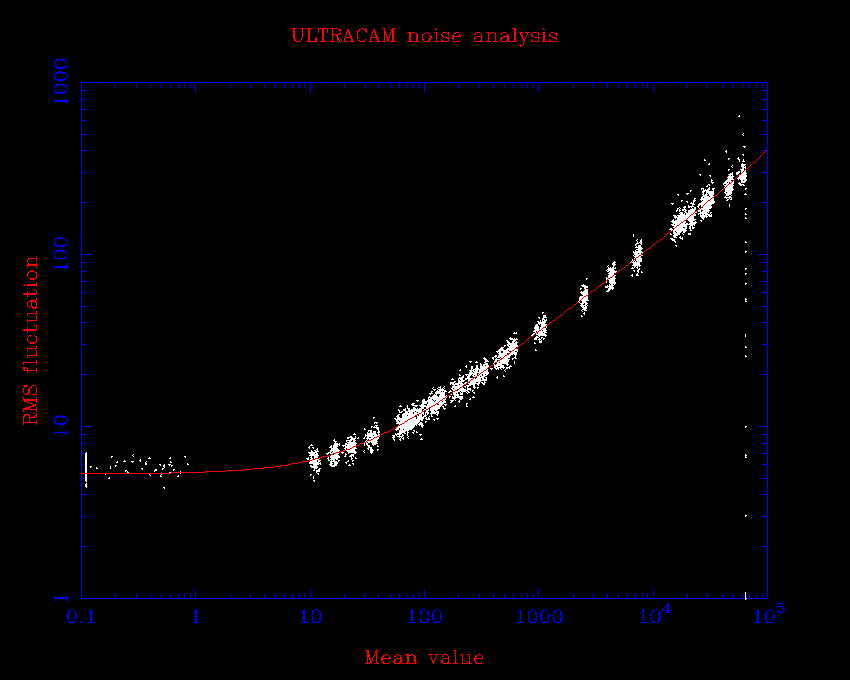
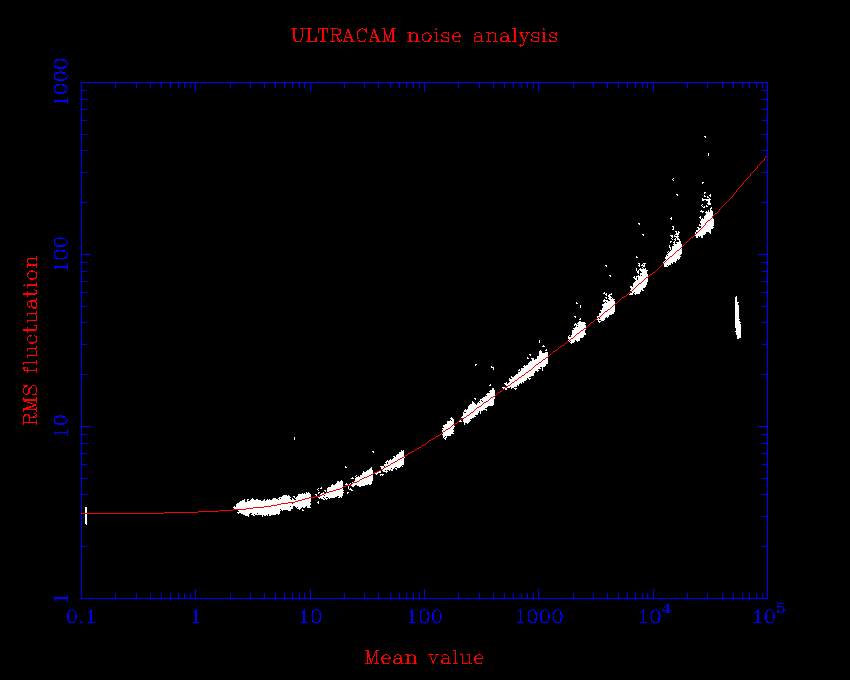
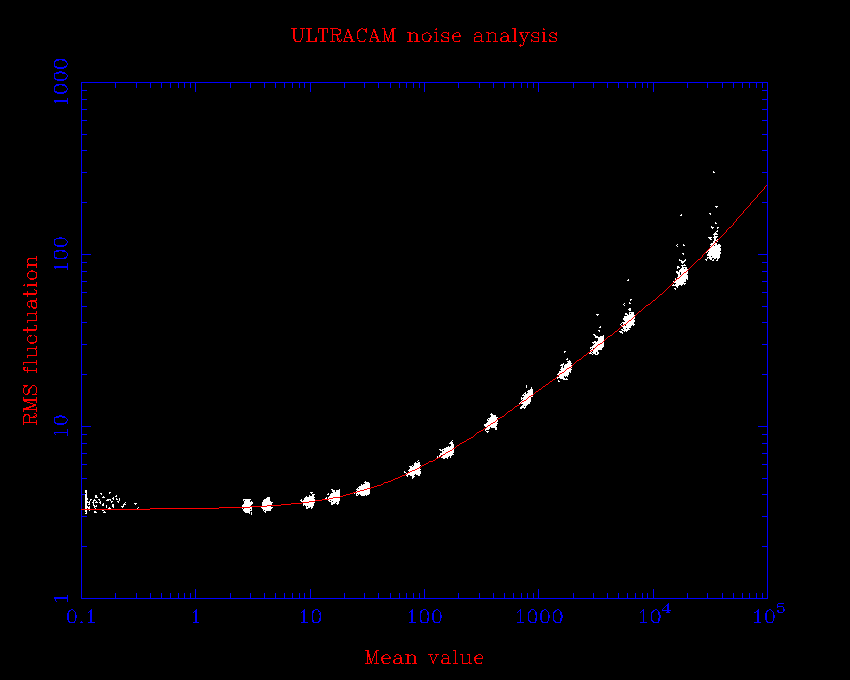
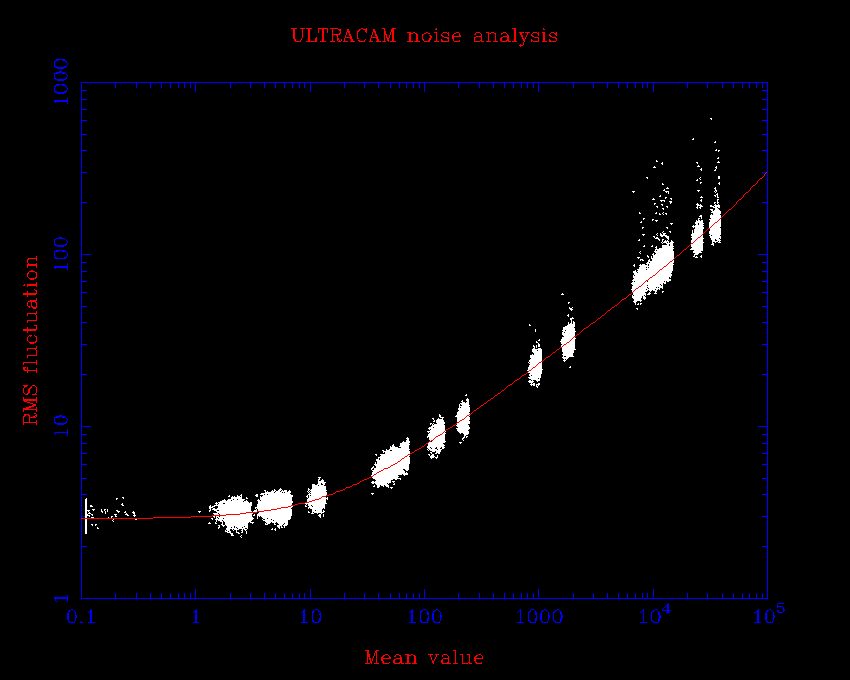
| METHOD | Ratio of two flats (17/04/2013) | Photon transfer curve (25/04/2013) (click on links for plots) | ||||
| CLEAR BIN 1x1 | SLOW | MEDIUM | FAST | SLOW | MEDIUM | FAST |
| BIAS (ADU) | 833 | 976 | 1089 | |||
| RNO (ADU) | 2.9 | 3.9 | 5.5 | 2.9 | 3.9 | 5.4 |
| RNO (e-) | 2.3 | 2.7 | 4.4 | 2.3 | 2.7 | 4.3 |
| GAIN (e-/ADU) | 0.8 | 0.7 | 0.8 | 0.8 | 0.7 | 0.8 |
| FLATFIELD NOISE (%) | 0.3 | 0.3 | 0.3 | |||
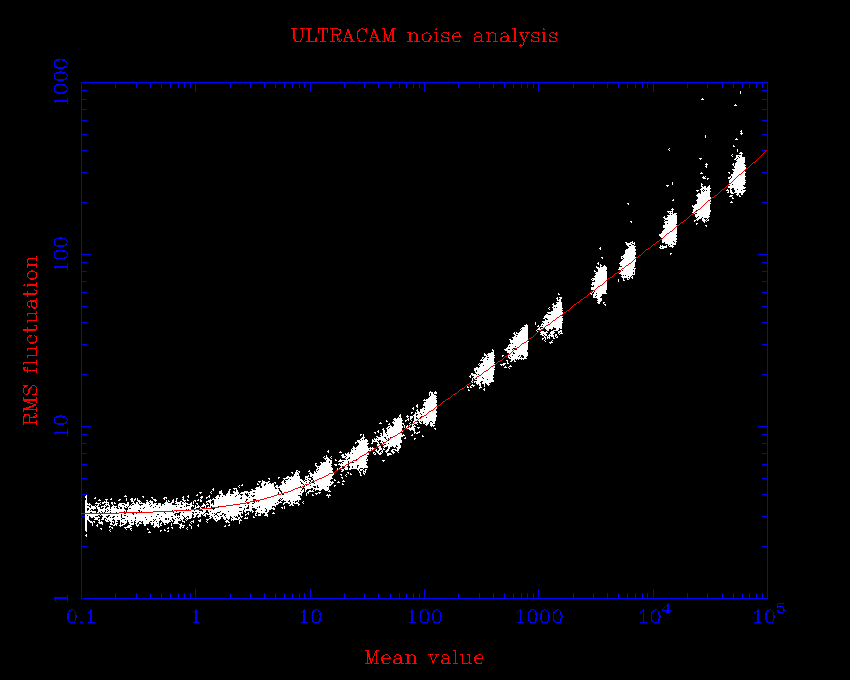
NOTE: The above measurements were obtained in CLEAR mode. However, tests show that similar results are obtained if NOCLEAR mode is used (see table below).
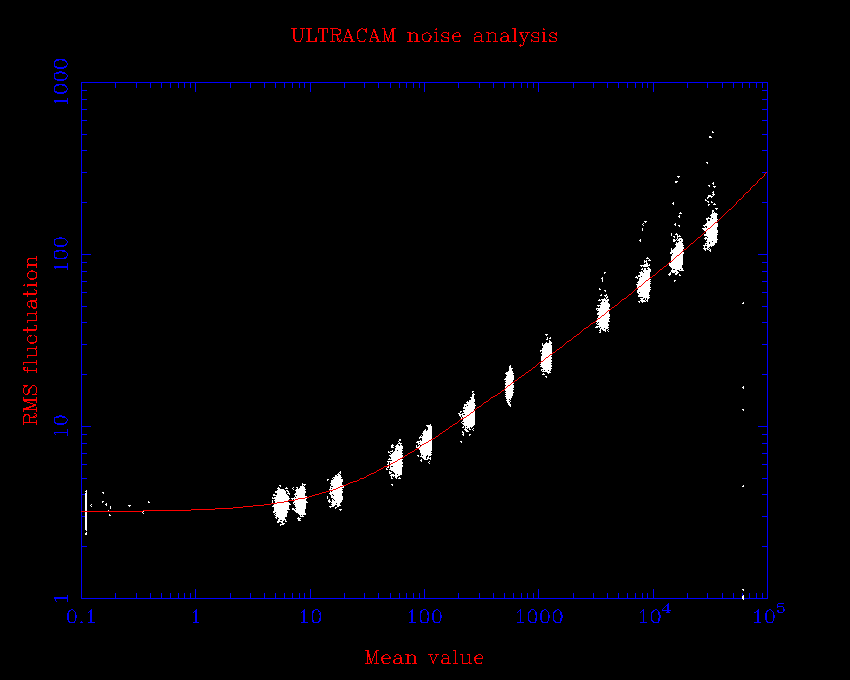
| METHOD | Photon transfer curve + bias frame (01/05/2013 click on links for plots) | ||
| NO CLEAR BIN 1x1 | SLOW | MEDIUM | FAST |
| BIAS (ADU) | 833 | 974 | 1092 |
| RNO (ADU) | 2.9 | 4.6 | 5.8 |
| RNO (e-) | 2.3 | 3.2 | 4.6 |
| GAIN (e-/ADU) | 0.8 | 0.7 | 0.8 |
| FLATFIELD NOISE (%) | 0.2 | 0.2 | 0.2 |
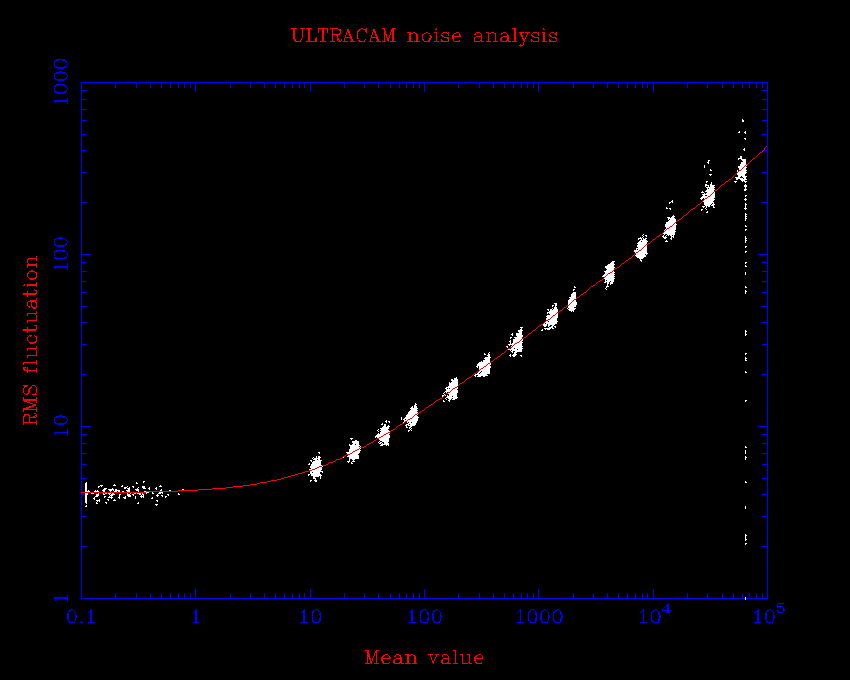
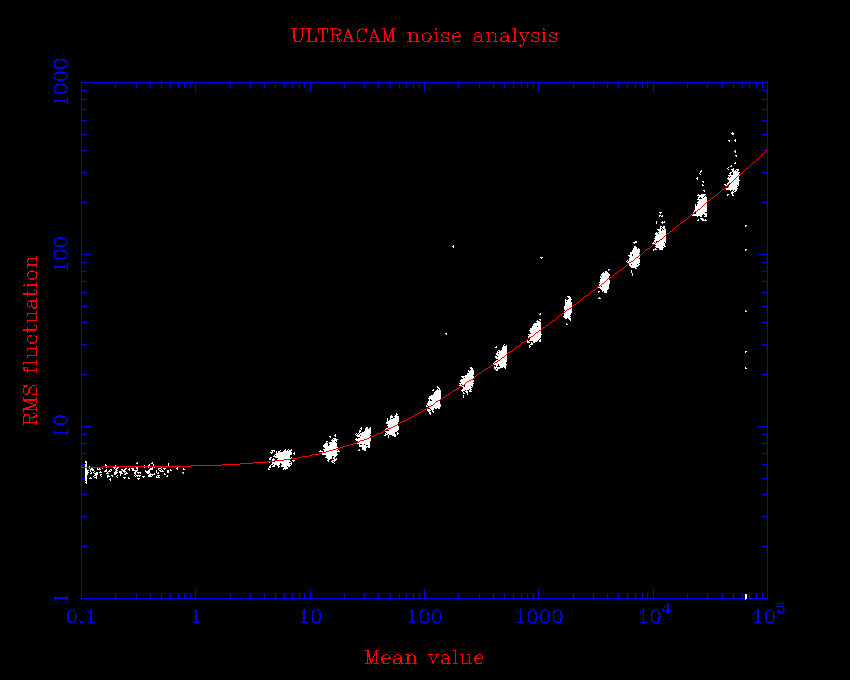
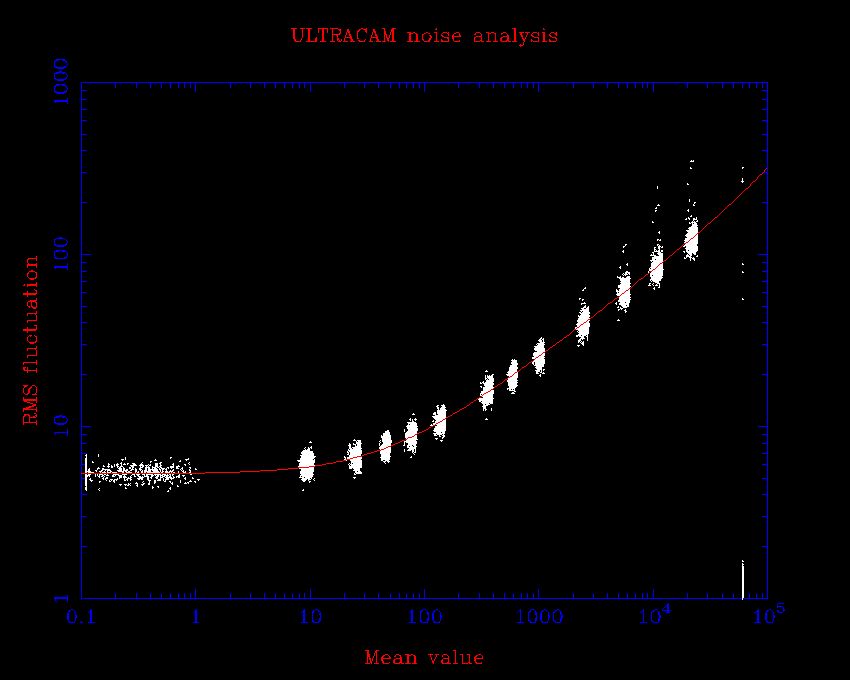
NOTE: Changing the binning factor makes little difference, as shown in the two tables below:
| METHOD | Photon transfer curve + bias frame (01/05/2013 click on links for plots) | ||
| BIN 2x2 | SLOW | MEDIUM | FAST |
| BIAS (ADU) | 811 | 920 | 845 |
| RNO (ADU) | 3.0 | 4.6 | 5.8 |
| RNO (e-) | 2.4 | 3.2 | 4.6 |
| GAIN (e-/ADU) | 0.8 | 0.7 | 0.8 |
| FLATFIELD NOISE (%) | 0.2 | 0.2 | 0.2 |
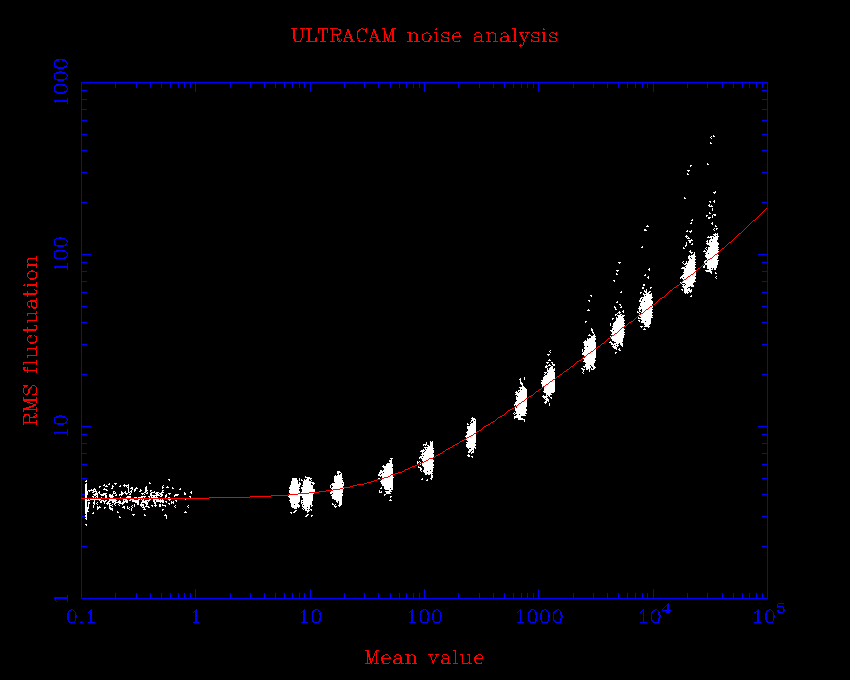
| METHOD | Photon transfer curve + bias frame (01/05/2013 click on links for plots) | ||
| BIN 3x3 | SLOW | MEDIUM | FAST |
| BIAS (ADU) | 822 | 932 | 863 |
| RNO (ADU) | 3.1 | 4.1 | 5.8 |
| RNO (e-) | 2.5 | 2.9 | 4.6 |
| GAIN (e-/ADU) | 0.8 | 0.7 | 0.8 |
| FLATFIELD NOISE (%) | 0.2 | 0.2 | 0.2 |
NOTE: The above measurements were obtained in NON-DRIFT mode. However, tests show that similar results are obtained if DRIFT mode is used (see tables below).
| METHOD | Photon transfer curve + bias frame (01/05/2013 click on links for plots) | ||
| DRIFT BIN 1x1 | SLOW | MEDIUM | FAST |
| BIAS (ADU) | 832 | 973 | 1085 |
| RNO (ADU) | 2.9 | 3.9 | 5.0 |
| RNO (e-) | 2.3 | 2.7 | 4.0 |
| GAIN (e-/ADU) | 0.8 | 0.7 | 0.8 |
| FLATFIELD NOISE (%) | 0.3 | 0.3 | 0.3 |
| METHOD | Photon transfer curve + bias frame (01/05/2013 click on links for plots) | ||
| DRIFT BIN 2x2 | SLOW | MEDIUM | FAST |
| BIAS (ADU) | 810 | 918 | 843 |
| RNO (ADU) | 3.5 | 4.4 | 5.4 |
| RNO (e-) | 2.8 | 3.1 | 4.3 |
| GAIN (e-/ADU) | 0.8 | 0.7 | 0.8 |
| FLATFIELD NOISE (%) | 0.2 | 0.2 | 0.2 |
| METHOD | Photon transfer curve + bias frame (01/05/2013 click on links for plots) | ||
| DRIFT BIN 3x3 | SLOW | MEDIUM | FAST |
| BIAS (ADU) | 821 | 932 | 860 |
| RNO (ADU) | 3.6 | 4.3 | 5.3 |
| RNO (e-) | 2.9 | 3.0 | 4.2 |
| GAIN (e-/ADU) | 0.8 | 0.7 | 0.8 |
| FLATFIELD NOISE (%) | 0.2 | 0.2 | 0.2 |
Below are links to example bias frames taken in the lab in Sheffield and at the TNT. Both are taken in normal slow readout mode and are provided in ucm format.
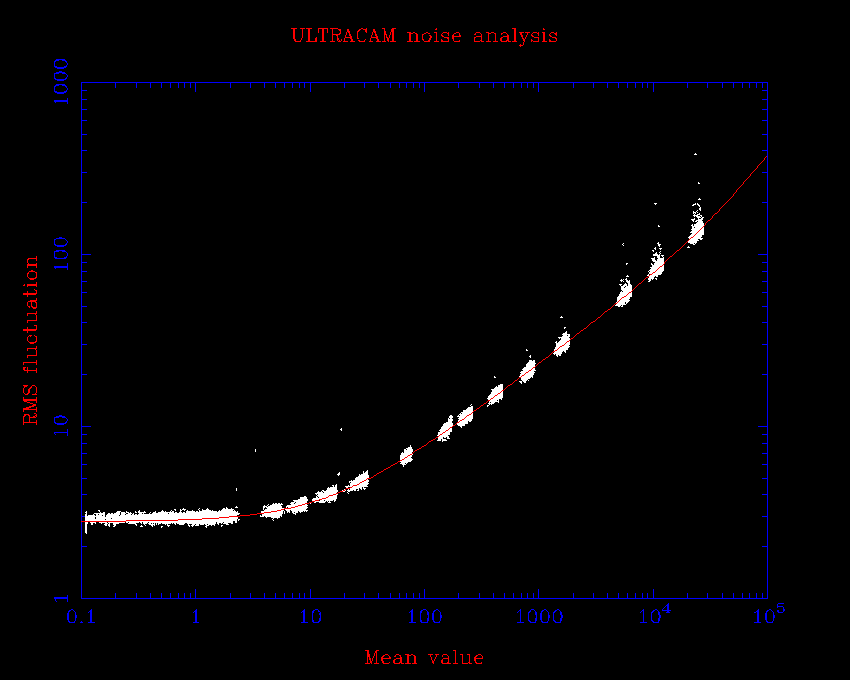
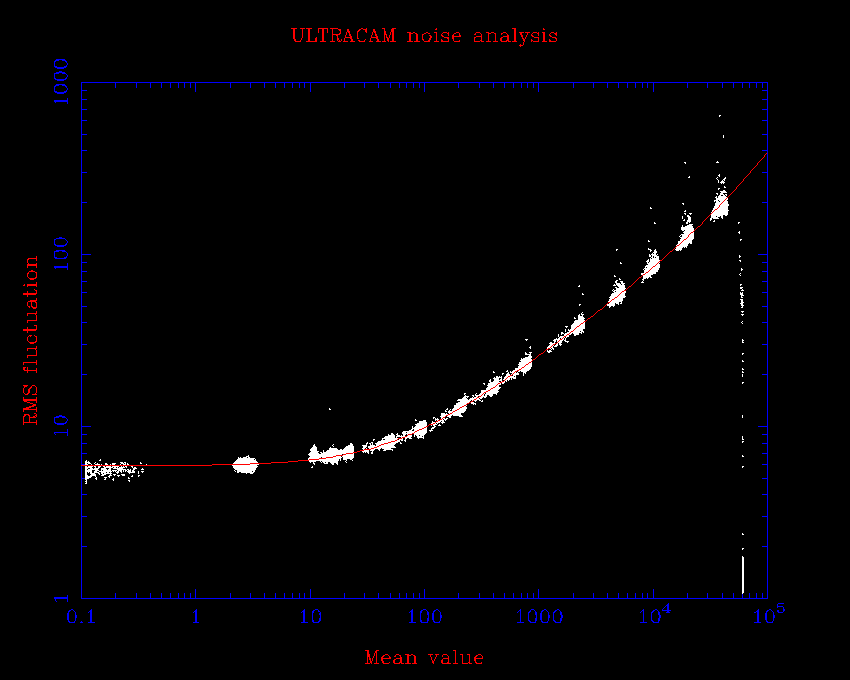
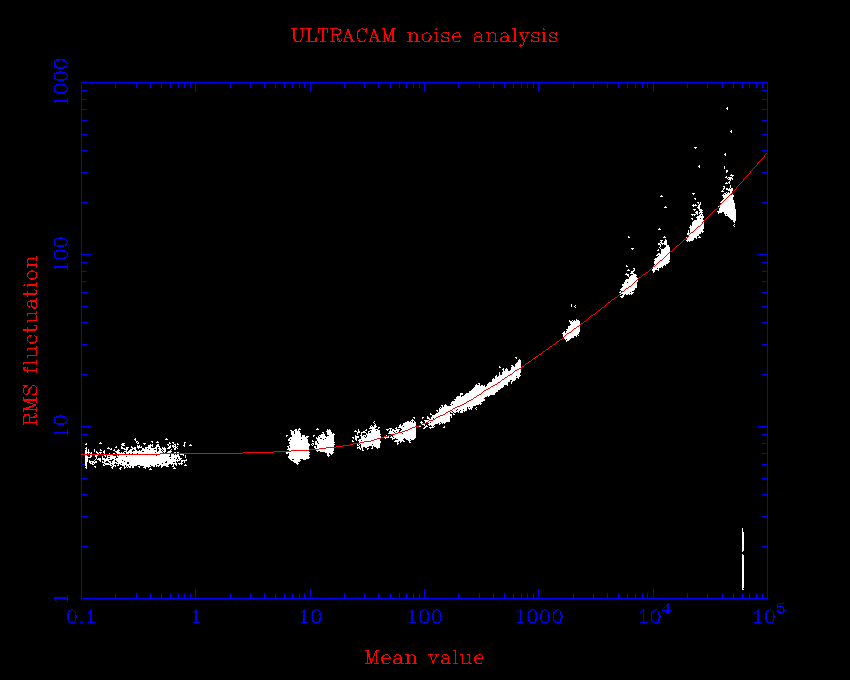
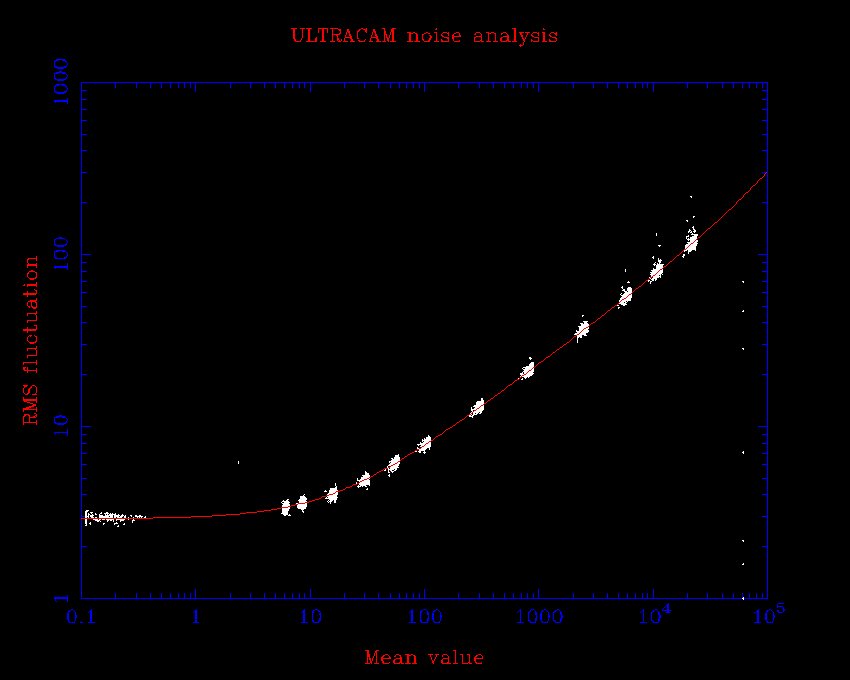
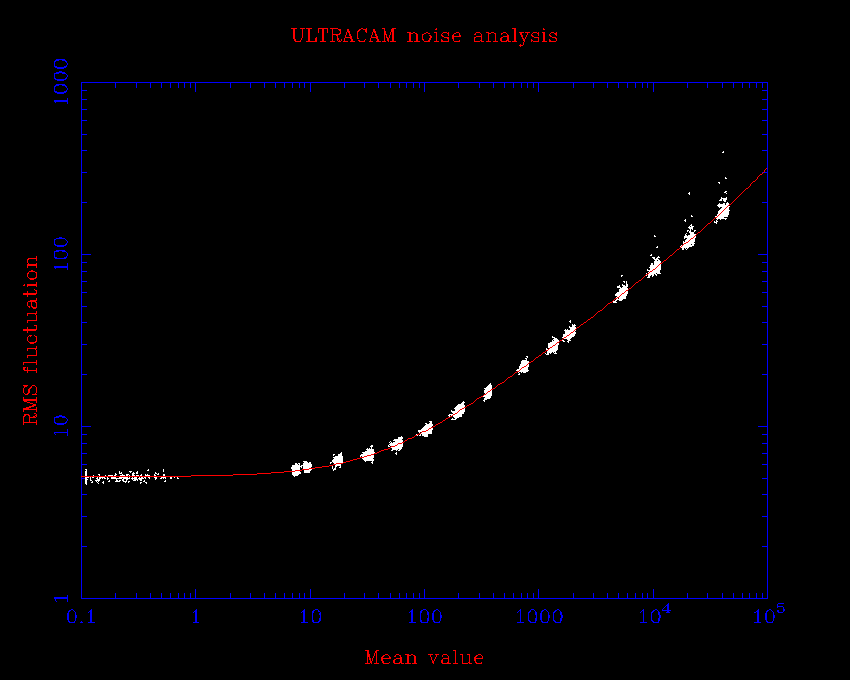
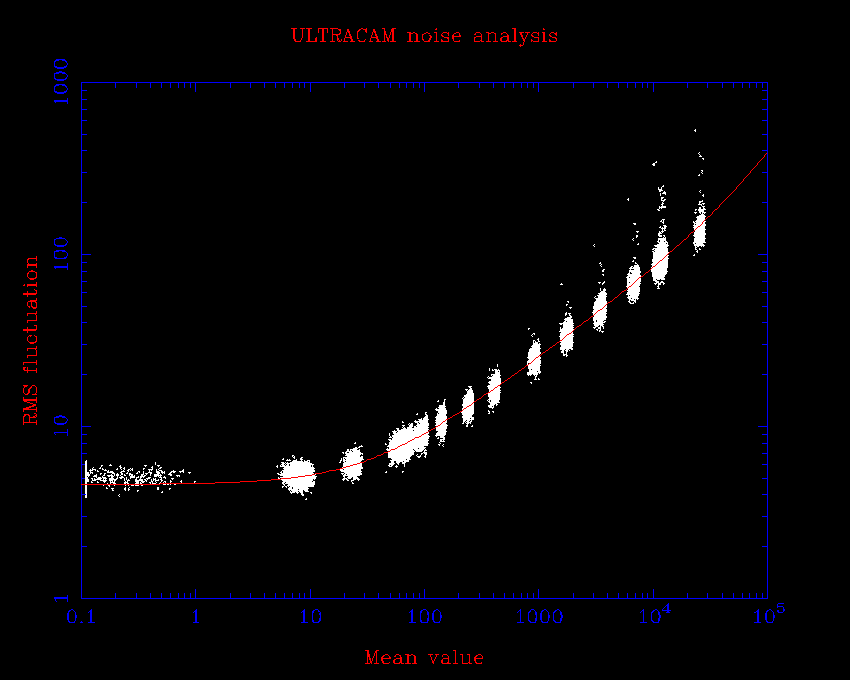
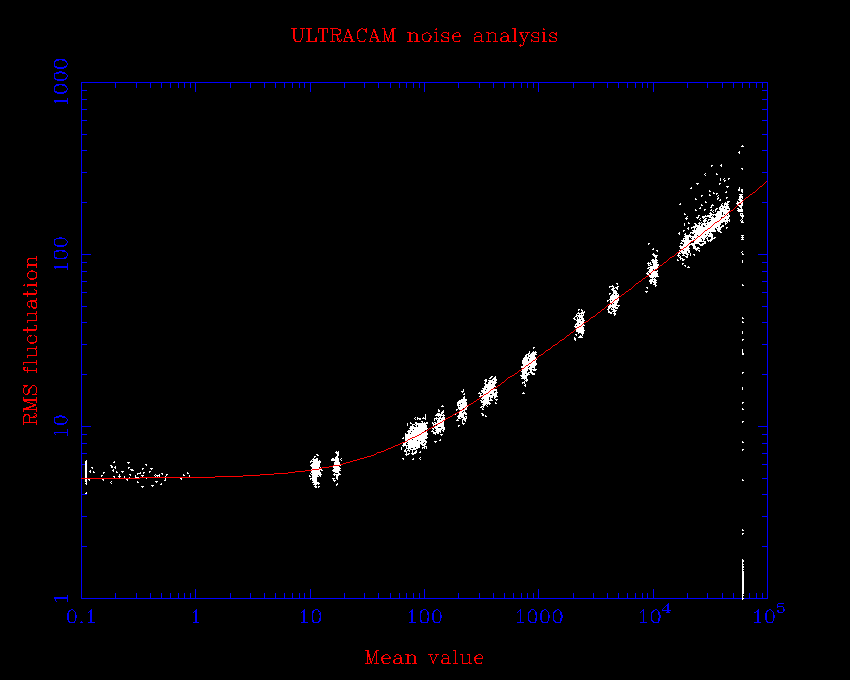
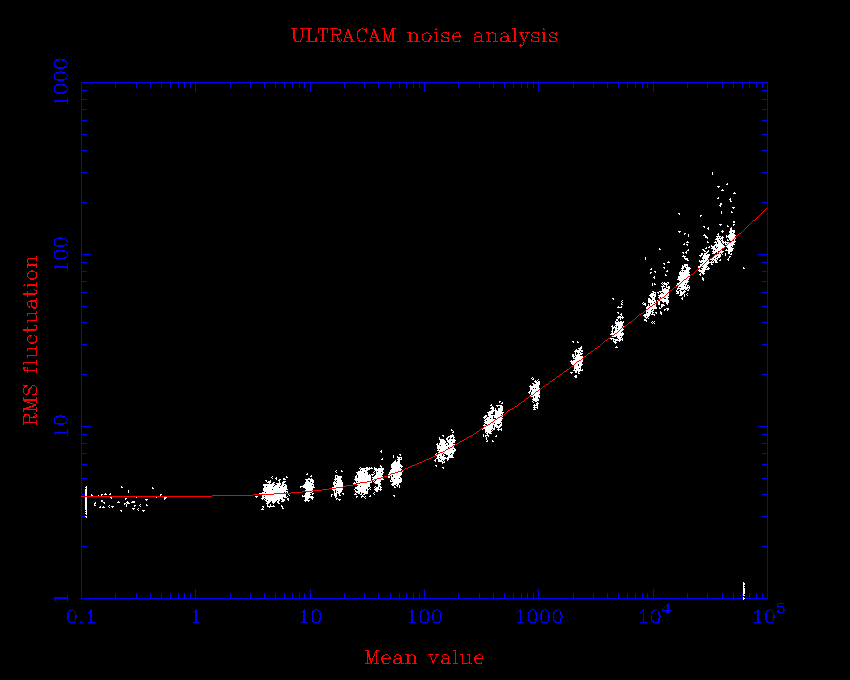
| METHOD | Ratio of two flats (17/04/2013) | Photon transfer curve (30/04/2013) (click on links for plots) | ||||
| CLEAR BIN 1x1 | SLOW | MEDIUM | FAST | SLOW | MEDIUM | FAST |
| BIAS (ADU) | 4396 | 4839 | 3695 | |||
| RNO (ADU) | 2.8 | 4.6 | 3.3 | 2.9 | 5.9 | 3.6 |
| RNO (e-) | 5.6 | 7.8 | 16.5 | 5.5 | 9.4 | 14.4 |
| GAIN (e-/ADU) | 1.9 | 1.6 | 4.1 | 1.9 | 1.6 | 4.0 |
| FLATFIELD NOISE (%) | 0.3 | 0.3 | 0.3 | |||
NOTE: The above measurements were obtained in CLEAR mode. However, tests show that similar results are obtained if NOCLEAR mode is used (see table below).
| METHOD | Photon transfer curve + bias frame (30/04/2013 click on links for plots) | ||
| NO CLEAR BIN 1x1 | SLOW | MEDIUM | FAST |
| BIAS (ADU) | 4394 | 4841 | 3695 |
| RNO (ADU) | 3.1 | 6.9 | 3.7 |
| RNO (e-) | 5.9 | 11.0 | 14.8 |
| GAIN (e-/ADU) | 1.9 | 1.6 | 4.0 |
| FLATFIELD NOISE (%) | 0.3 | 0.3 | 0.3 |
NOTE: Changing the binning factor makes little difference, as shown in the two tables below:
| METHOD | Photon transfer curve + bias frame (30/04/2013 click on links for plots) | ||
| BIN 2x2 | SLOW | MEDIUM | FAST |
| BIAS (ADU) | 4433 | 4822 | 3673 |
| RNO (ADU) | 2.9 | 5.1 | 3.3 |
| RNO (e-) | 5.5 | 8.2 | 13.2 |
| GAIN (e-/ADU) | 1.9 | 1.6 | 4.0 |
| FLATFIELD NOISE (%) | 0.2 | 0.2 | 0.2 |
| METHOD | Photon transfer curve + bias frame (30/04/2013 click on links for plots) | ||
| BIN 3x3 | SLOW | MEDIUM | FAST |
| BIAS (ADU) | 4447 | 4837 | 3677 |
| RNO (ADU) | 3.2 | 5.2 | 3.8 |
| RNO (e-) | 6.1 | 8.3 | 15.2 |
| GAIN (e-/ADU) | 1.9 | 1.6 | 4.0 |
| FLATFIELD NOISE (%) | 0.2 | 0.2 | 0.1 |
NOTE: The above measurements were obtained in NON-DRIFT mode. However, tests show that similar results are obtained if DRIFT mode is used (see tables below).
| METHOD | Photon transfer curve + bias frame (30/04/2013 click on links for plots) | ||
| DRIFT BIN 1x1 | SLOW | MEDIUM | FAST |
| BIAS (ADU) | 4393 | 4834 | 3695 |
| RNO (ADU) | 2.9 | 4.6 | 3.8 |
| RNO (e-) | 5.5 | 7.4 | 15.2 |
| GAIN (e-/ADU) | 1.9 | 1.6 | 4.0 |
| FLATFIELD NOISE (%) | 0.2 | 0.3 | 0.2 |
| METHOD | Photon transfer curve + bias frame (30/04/2013 click on links for plots) | ||
| DRIFT BIN 2x2 | SLOW | MEDIUM | FAST |
| BIAS (ADU) | 4433 | 4821 | 3673 |
| RNO (ADU) | 2.9 | 5.2 | 3.4 |
| RNO (e-) | 5.5 | 8.3 | 13.6 |
| GAIN (e-/ADU) | 1.9 | 1.6 | 4.0 |
| FLATFIELD NOISE (%) | 0.1 | 0.2 | 0.1 |
| METHOD | Photon transfer curve + bias frame (30/04/2013 click on links for plots) | ||
| DRIFT BIN 3x3 | SLOW | MEDIUM | FAST |
| BIAS (ADU) | 4447 | 4837 | 3677 |
| RNO (ADU) | 3.0 | 5.0 | 3.9 |
| RNO (e-) | 5.7 | 8.0 | 15.6 |
| GAIN (e-/ADU) | 1.9 | 1.6 | 4.0 |
| FLATFIELD NOISE (%) | 0.1 | 0.1 | 0.1 |
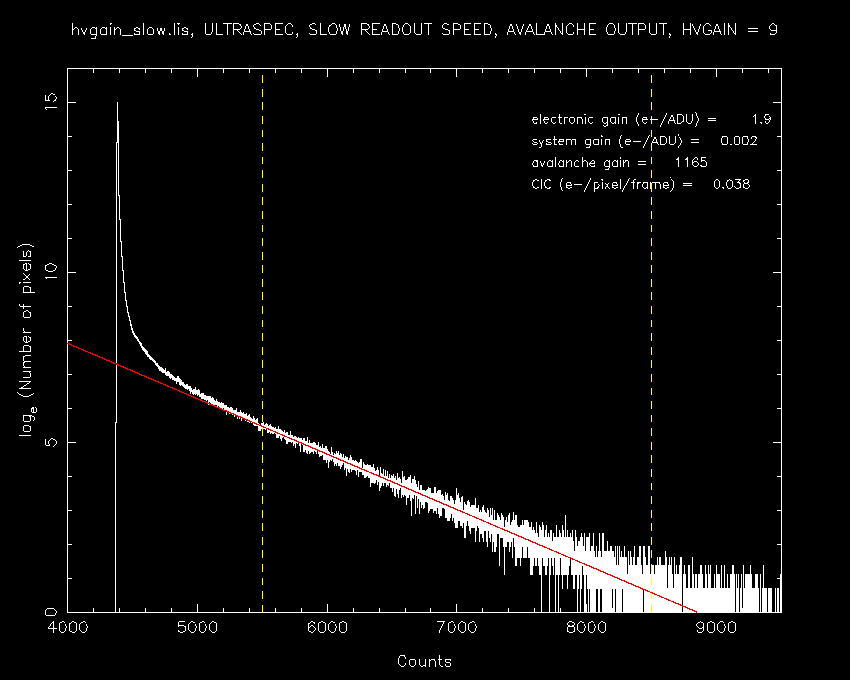
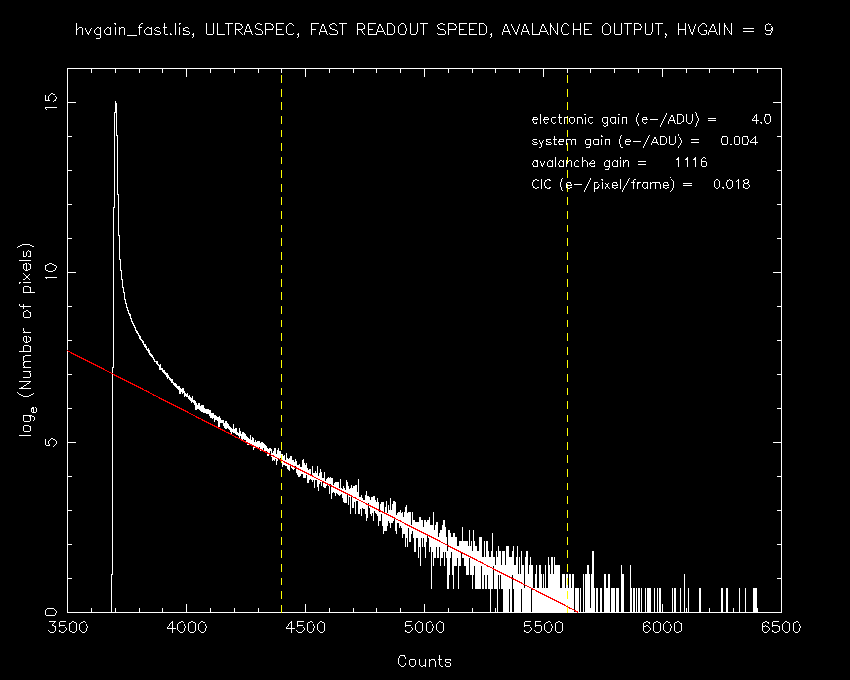
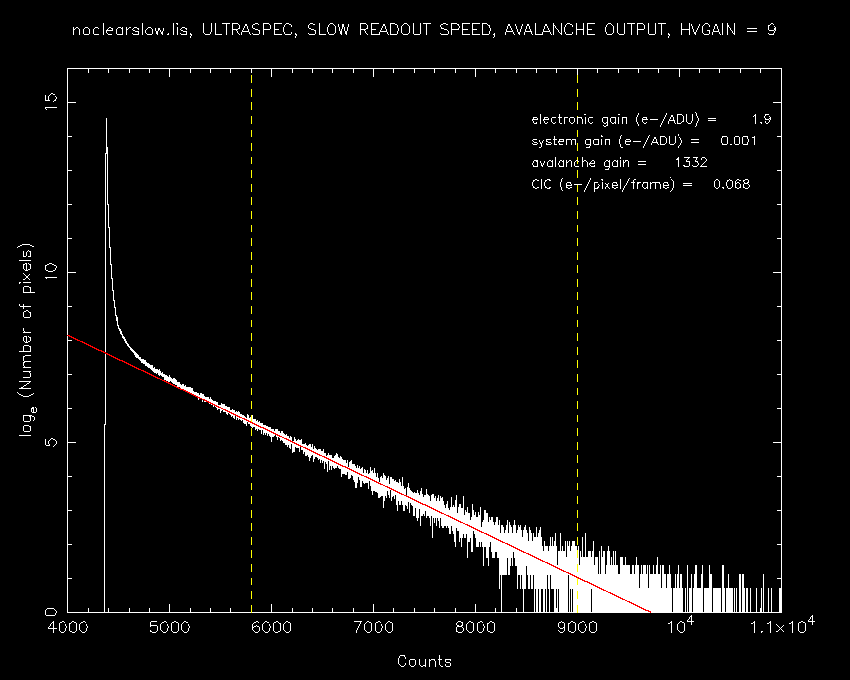
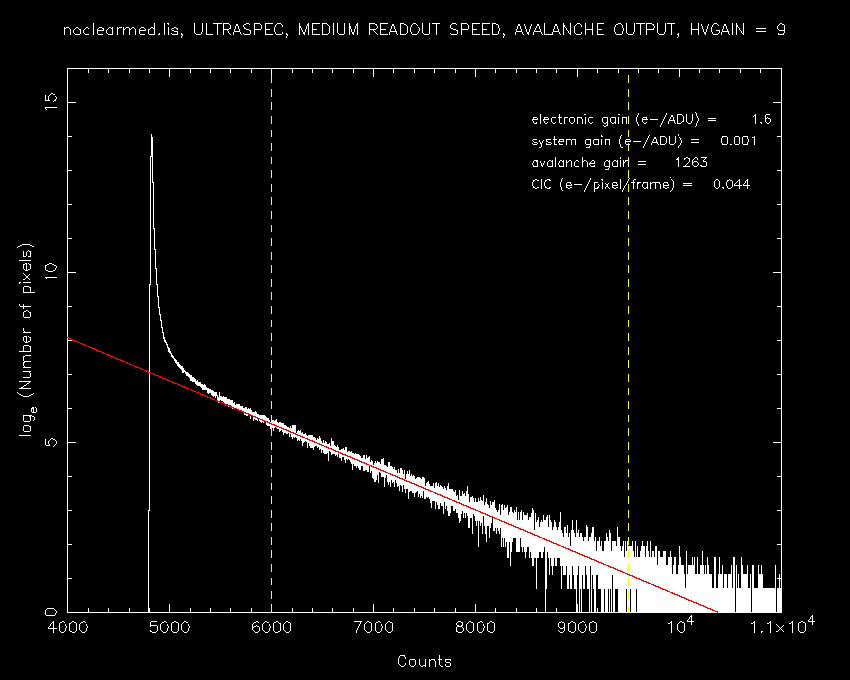
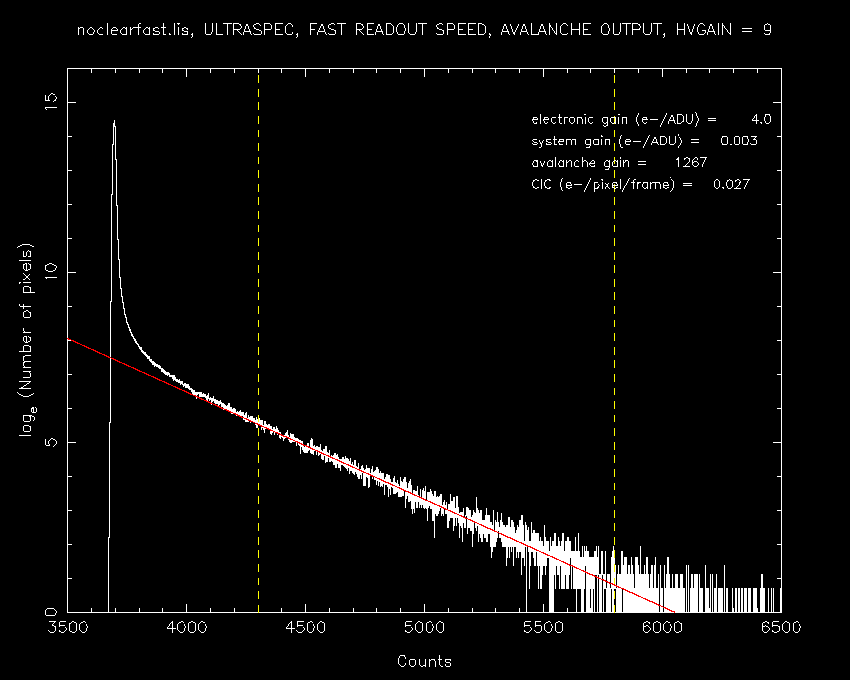
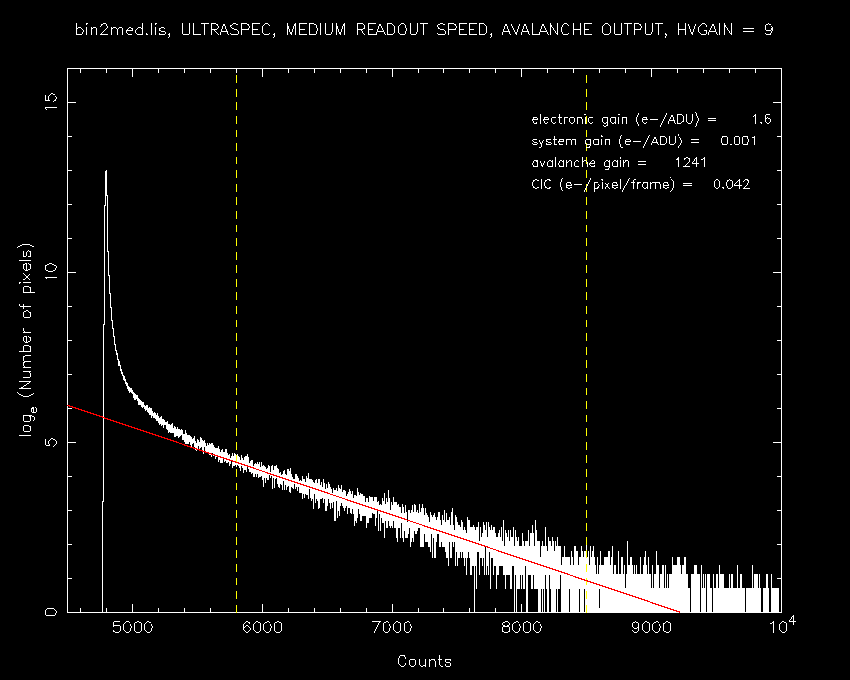
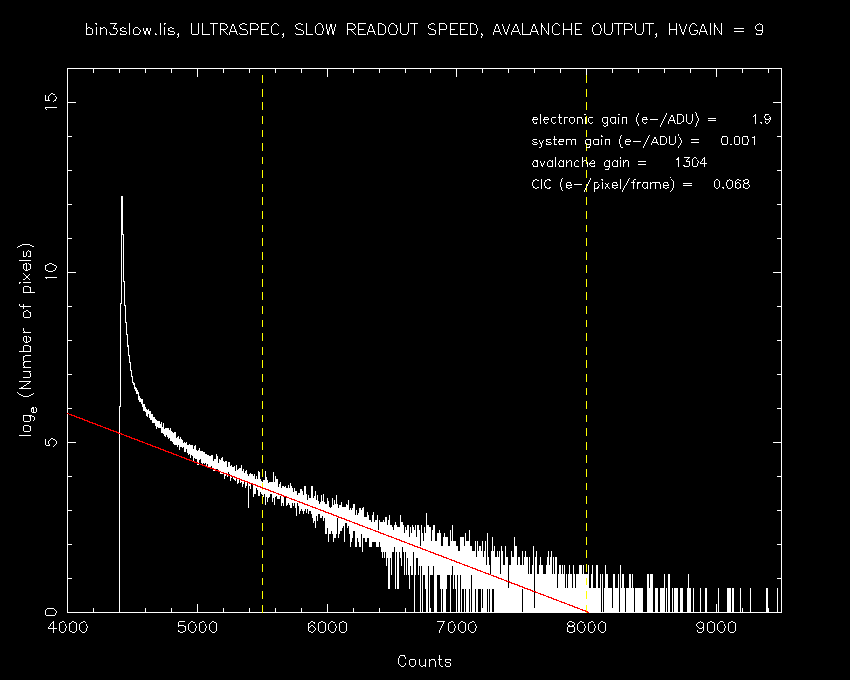
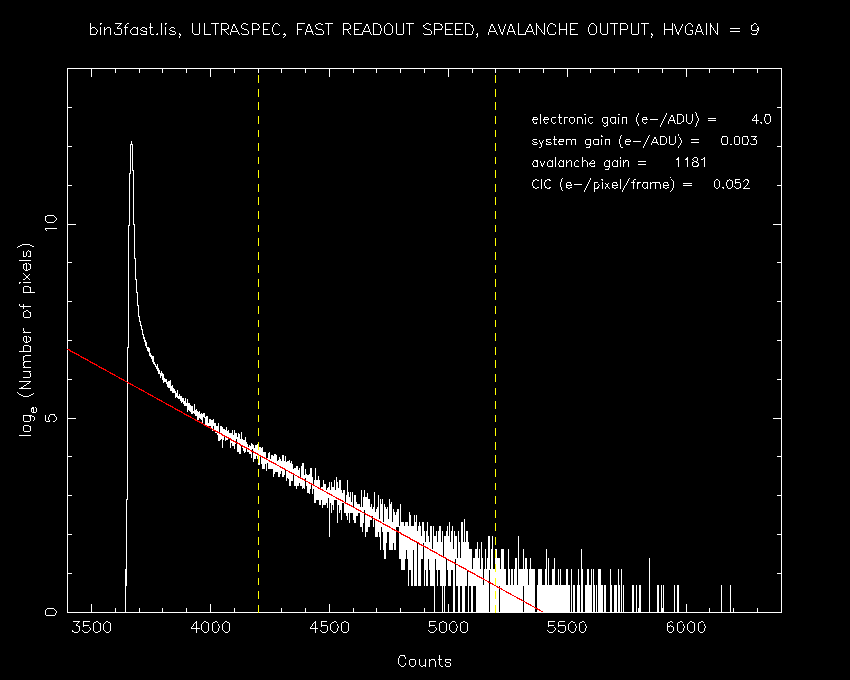
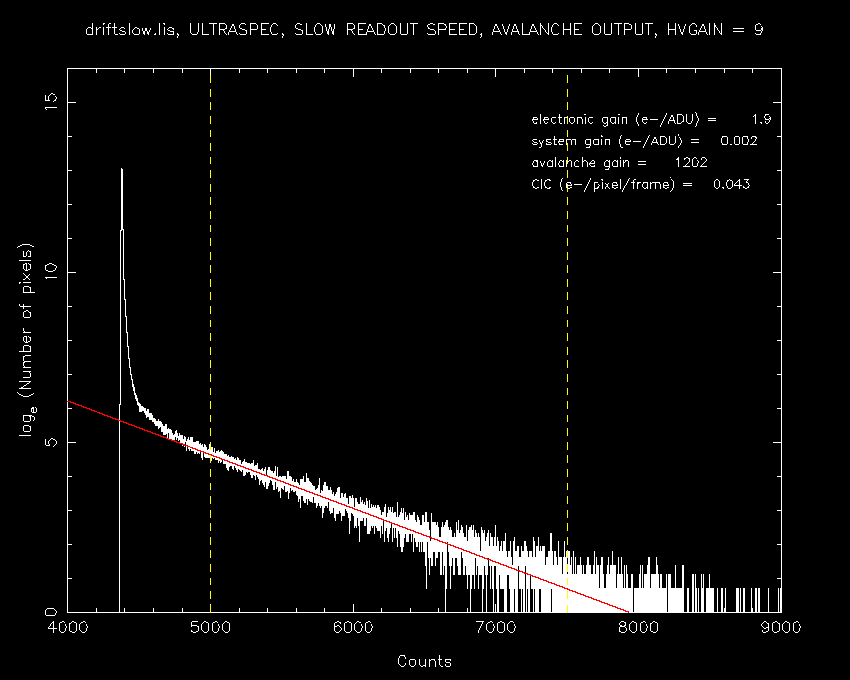
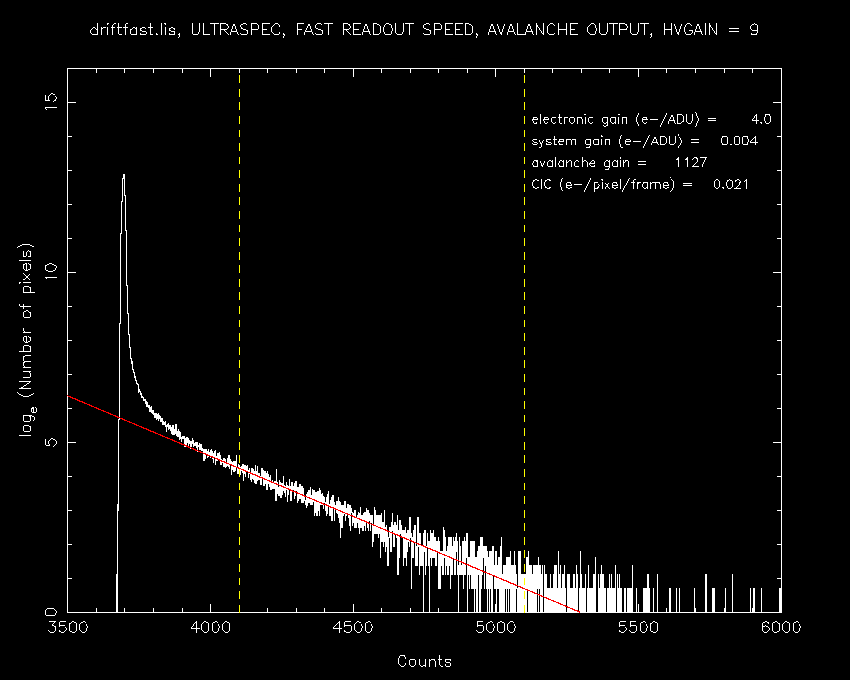
A note on gain in avalanche mode. We use the following definition:
| METHOD | HVGAIN=9 BIAS HISTOGRAM (25/04/2013) (click on links for plots) | ||
| CLEAR BIN 1x1 | SLOW | MEDIUM | FAST |
| ELECTRONIC GAIN (e-/ADU) | 1.9 | 1.6 | 4.0 |
| SYSTEM GAIN (e-/ADU) | 0.002 | 0.001 | 0.004 |
| AVALANCHE GAIN | 1165 | 1109 | 1116 |
| CIC (e-/pix/frame) | 0.038 | 0.021 | 0.018 |
| METHOD | HVGAIN=9 BIAS HISTOGRAM (30/04/2013) (click on links for plots) | ||
| NO CLEAR BIN 1x1 | SLOW | MEDIUM | FAST |
| ELECTRONIC GAIN (e-/ADU) | 1.9 | 1.6 | 4.0 |
| SYSTEM GAIN (e-/ADU) | 0.001 | 0.001 | 0.003 |
| AVALANCHE GAIN | 1332 | 1263 | 1267 |
| CIC (e-/pix/frame) | 0.068 | 0.044 | 0.027 |
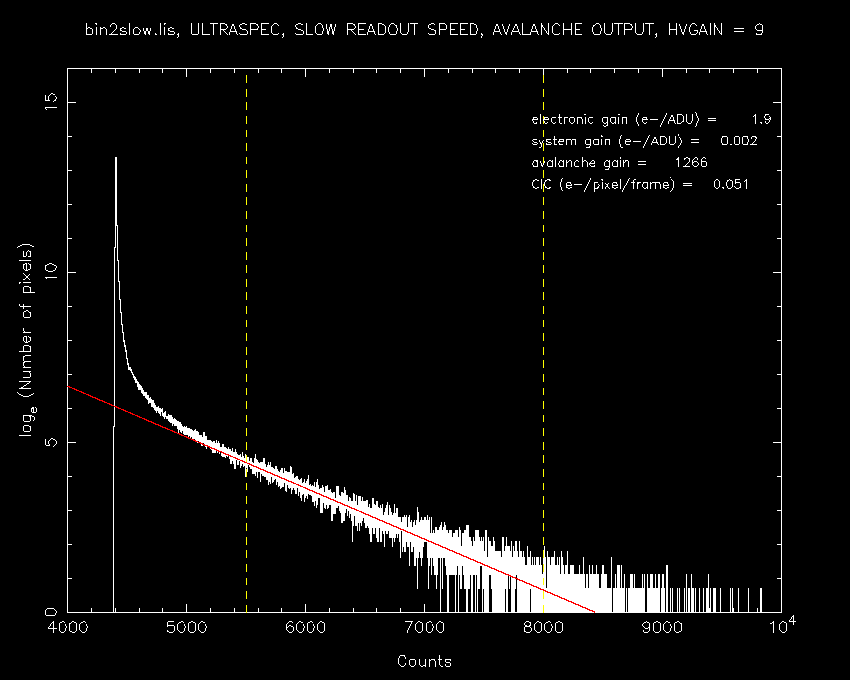
| METHOD | HVGAIN=9 BIAS HISTOGRAM (30/04/2013) (click on links for plots) | ||
| BIN 2x2 | SLOW | MEDIUM | FAST |
| ELECTRONIC GAIN (e-/ADU) | 1.9 | 1.6 | 4.0 |
| SYSTEM GAIN (e-/ADU) | 0.002 | 0.001 | 0.003 |
| AVALANCHE GAIN | 1266 | 1241 | 1238 |
| CIC (e-/pix/frame) | 0.051 | 0.042 | 0.035 |
| METHOD | HVGAIN=9 BIAS HISTOGRAM (30/04/2013) (click on links for plots) | ||
| BIN 3x3 | SLOW | MEDIUM | FAST |
| ELECTRONIC GAIN (e-/ADU) | 1.9 | 1.6 | 4.0 |
| SYSTEM GAIN (e-/ADU) | 0.001 | 0.001 | 0.003 |
| AVALANCHE GAIN | 1304 | 1190 | 1181 |
| CIC (e-/pix/frame) | 0.068 | 0.062 | 0.052 |
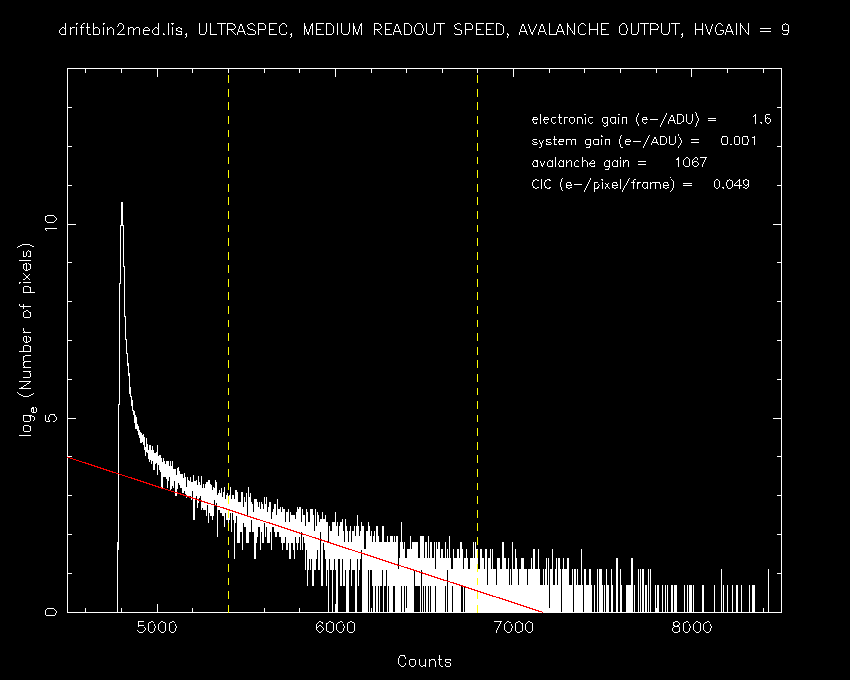
| METHOD | HVGAIN=9 BIAS HISTOGRAM (30/04/2013) (click on links for plots) | ||
| DRIFT BIN 1x1 | SLOW | MEDIUM | FAST |
| ELECTRONIC GAIN (e-/ADU) | 1.9 | 1.6 | 4.0 |
| SYSTEM GAIN (e-/ADU) | 0.002 | 0.001 | 0.004 |
| AVALANCHE GAIN | 1202 | 1164 | 1127 |
| CIC (e-/pix/frame) | 0.043 | 0.029 | 0.021 |
| METHOD | HVGAIN=9 BIAS HISTOGRAM (30/04/2013) (click on links for plots) | ||
| DRIFT BIN 2x2 | SLOW | MEDIUM | FAST |
| ELECTRONIC GAIN (e-/ADU) | 1.9 | 1.6 | 4.0 |
| SYSTEM GAIN (e-/ADU) | 0.002 | 0.001 | 0.003 |
| AVALANCHE GAIN | 1148 | 1067 | 1158 |
| CIC (e-/pix/frame) | 0.059 | 0.049 | 0.035 |
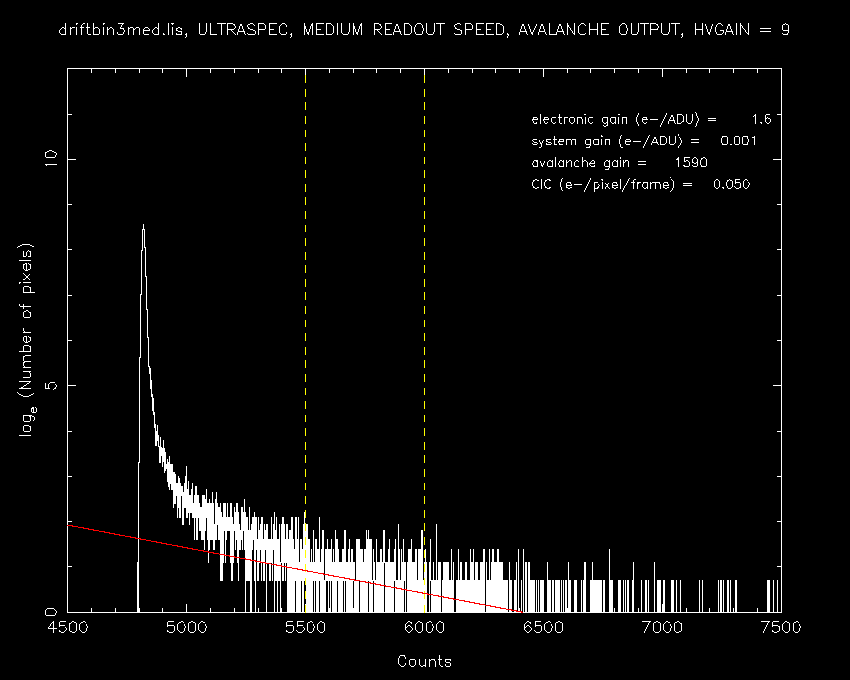
| METHOD | HVGAIN=9 BIAS HISTOGRAM (30/04/2013) (click on links for plots) | ||
| DRIFT BIN 3x3 | SLOW | MEDIUM | FAST |
| ELECTRONIC GAIN (e-/ADU) | 1.9 | 1.6 | 4.0 |
| SYSTEM GAIN (e-/ADU) | 0.001 | 0.001 | 0.002 |
| AVALANCHE GAIN | 1297 | 1590 | 2495 |
| CIC (e-/pix/frame) | 0.074 | 0.050 | 0.028 |
NOTE: Values in the final two tables come with significant uncertainties, due to the frames having small areas, thus fewer pixels. This means the histograms produced are less accurate, as can be seen in the plots.
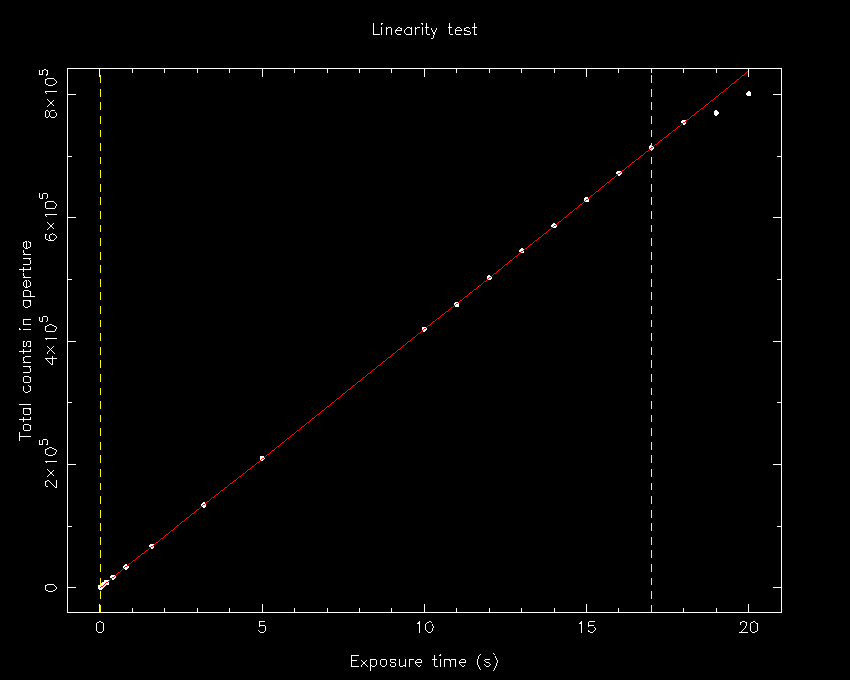
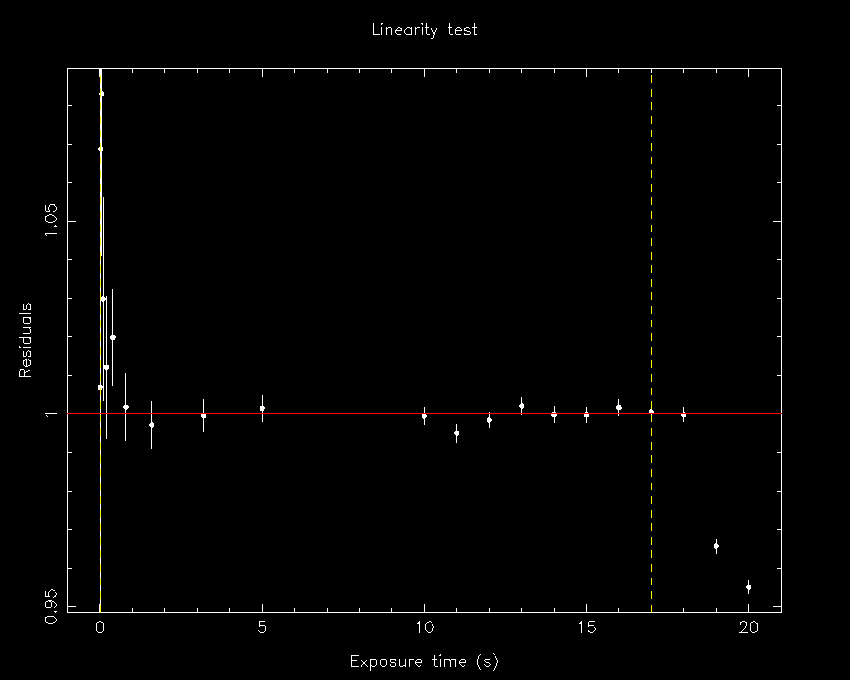
NOTE 11/06/13: After several fixing several problems and opening up the cryostat on a number of occasions, the avalanche gain has dropped significantly to values closer to ~700, rather than ~1200 as before.This was measured using the artificial star in the lab at Sheffield. The data were taken unbinned, using the normal output in clear mode with slow readout. The first plot below shows the total counts measured within the aperture centred on the star as a function of exposure time. Note that the peak counts per pixel at exposure times of 16, 17, 18, 19 and 20 seconds were 59733, 62133, 65535, 65535 and 65535, respectively. The second plot shows the residuals, where the data have been divided by the fit. It can be seen that the device is linear to better than 1% across its entire dynamic range, with the exception of the shortest exposure times, where the effect of the frame transfer is apparent. The data used to make this plot are available here.
| TIME SINCE PON (mins) | DARK CURRENT (electrons/pix/hr) |
| 0 | 148 |
| +10 | 24 |
| +20 | 19 |
| +30 | 19 |
| +40 | 14 |
| +50 | 14 |
| +60 | 14 |
| +70 | 10 |
| +80 | 10 |
| +90 | 10 |
| +100 | 10 |
| ...+180 | 10 |
The above data were measured on 07/06/2013 with the chip at 160 K, using normal, clear, slow read-out mode and 600 s exposures. The data are shown graphically below:
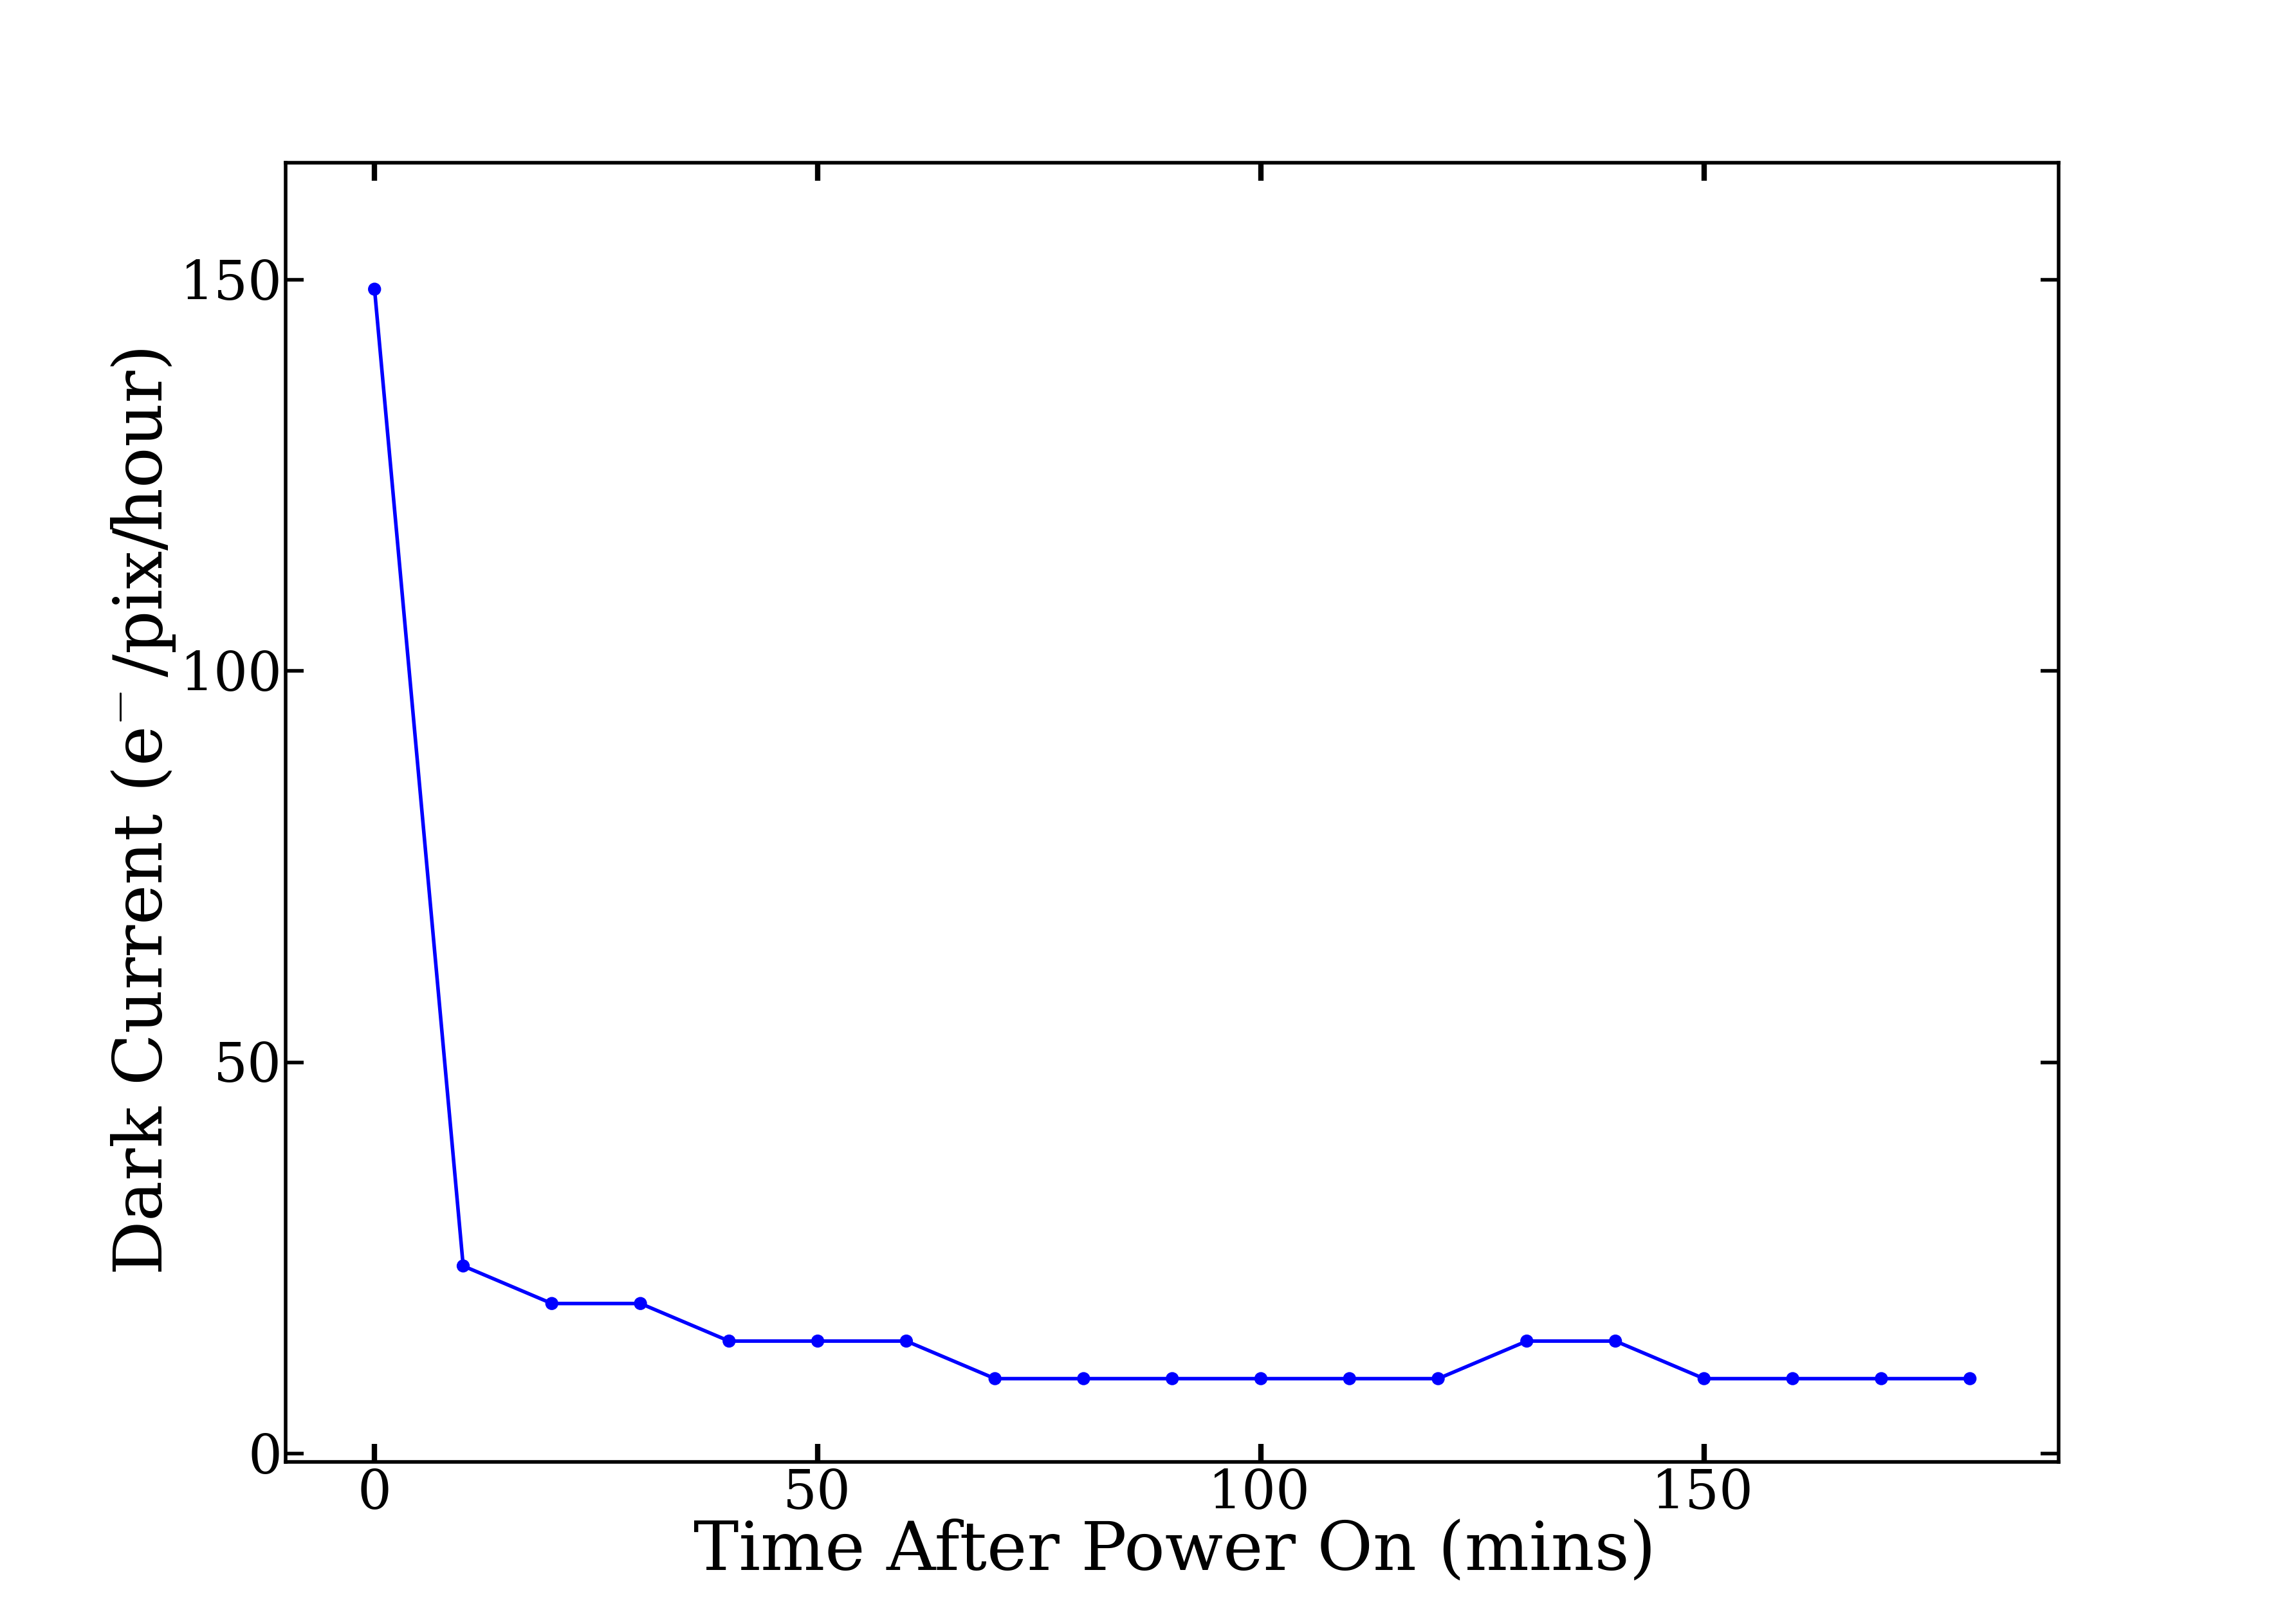
The linearity of dark current with time was also measured, and the dark current per unit time was found to remain constant for varying lengths of exposure longer than 5 minutes.
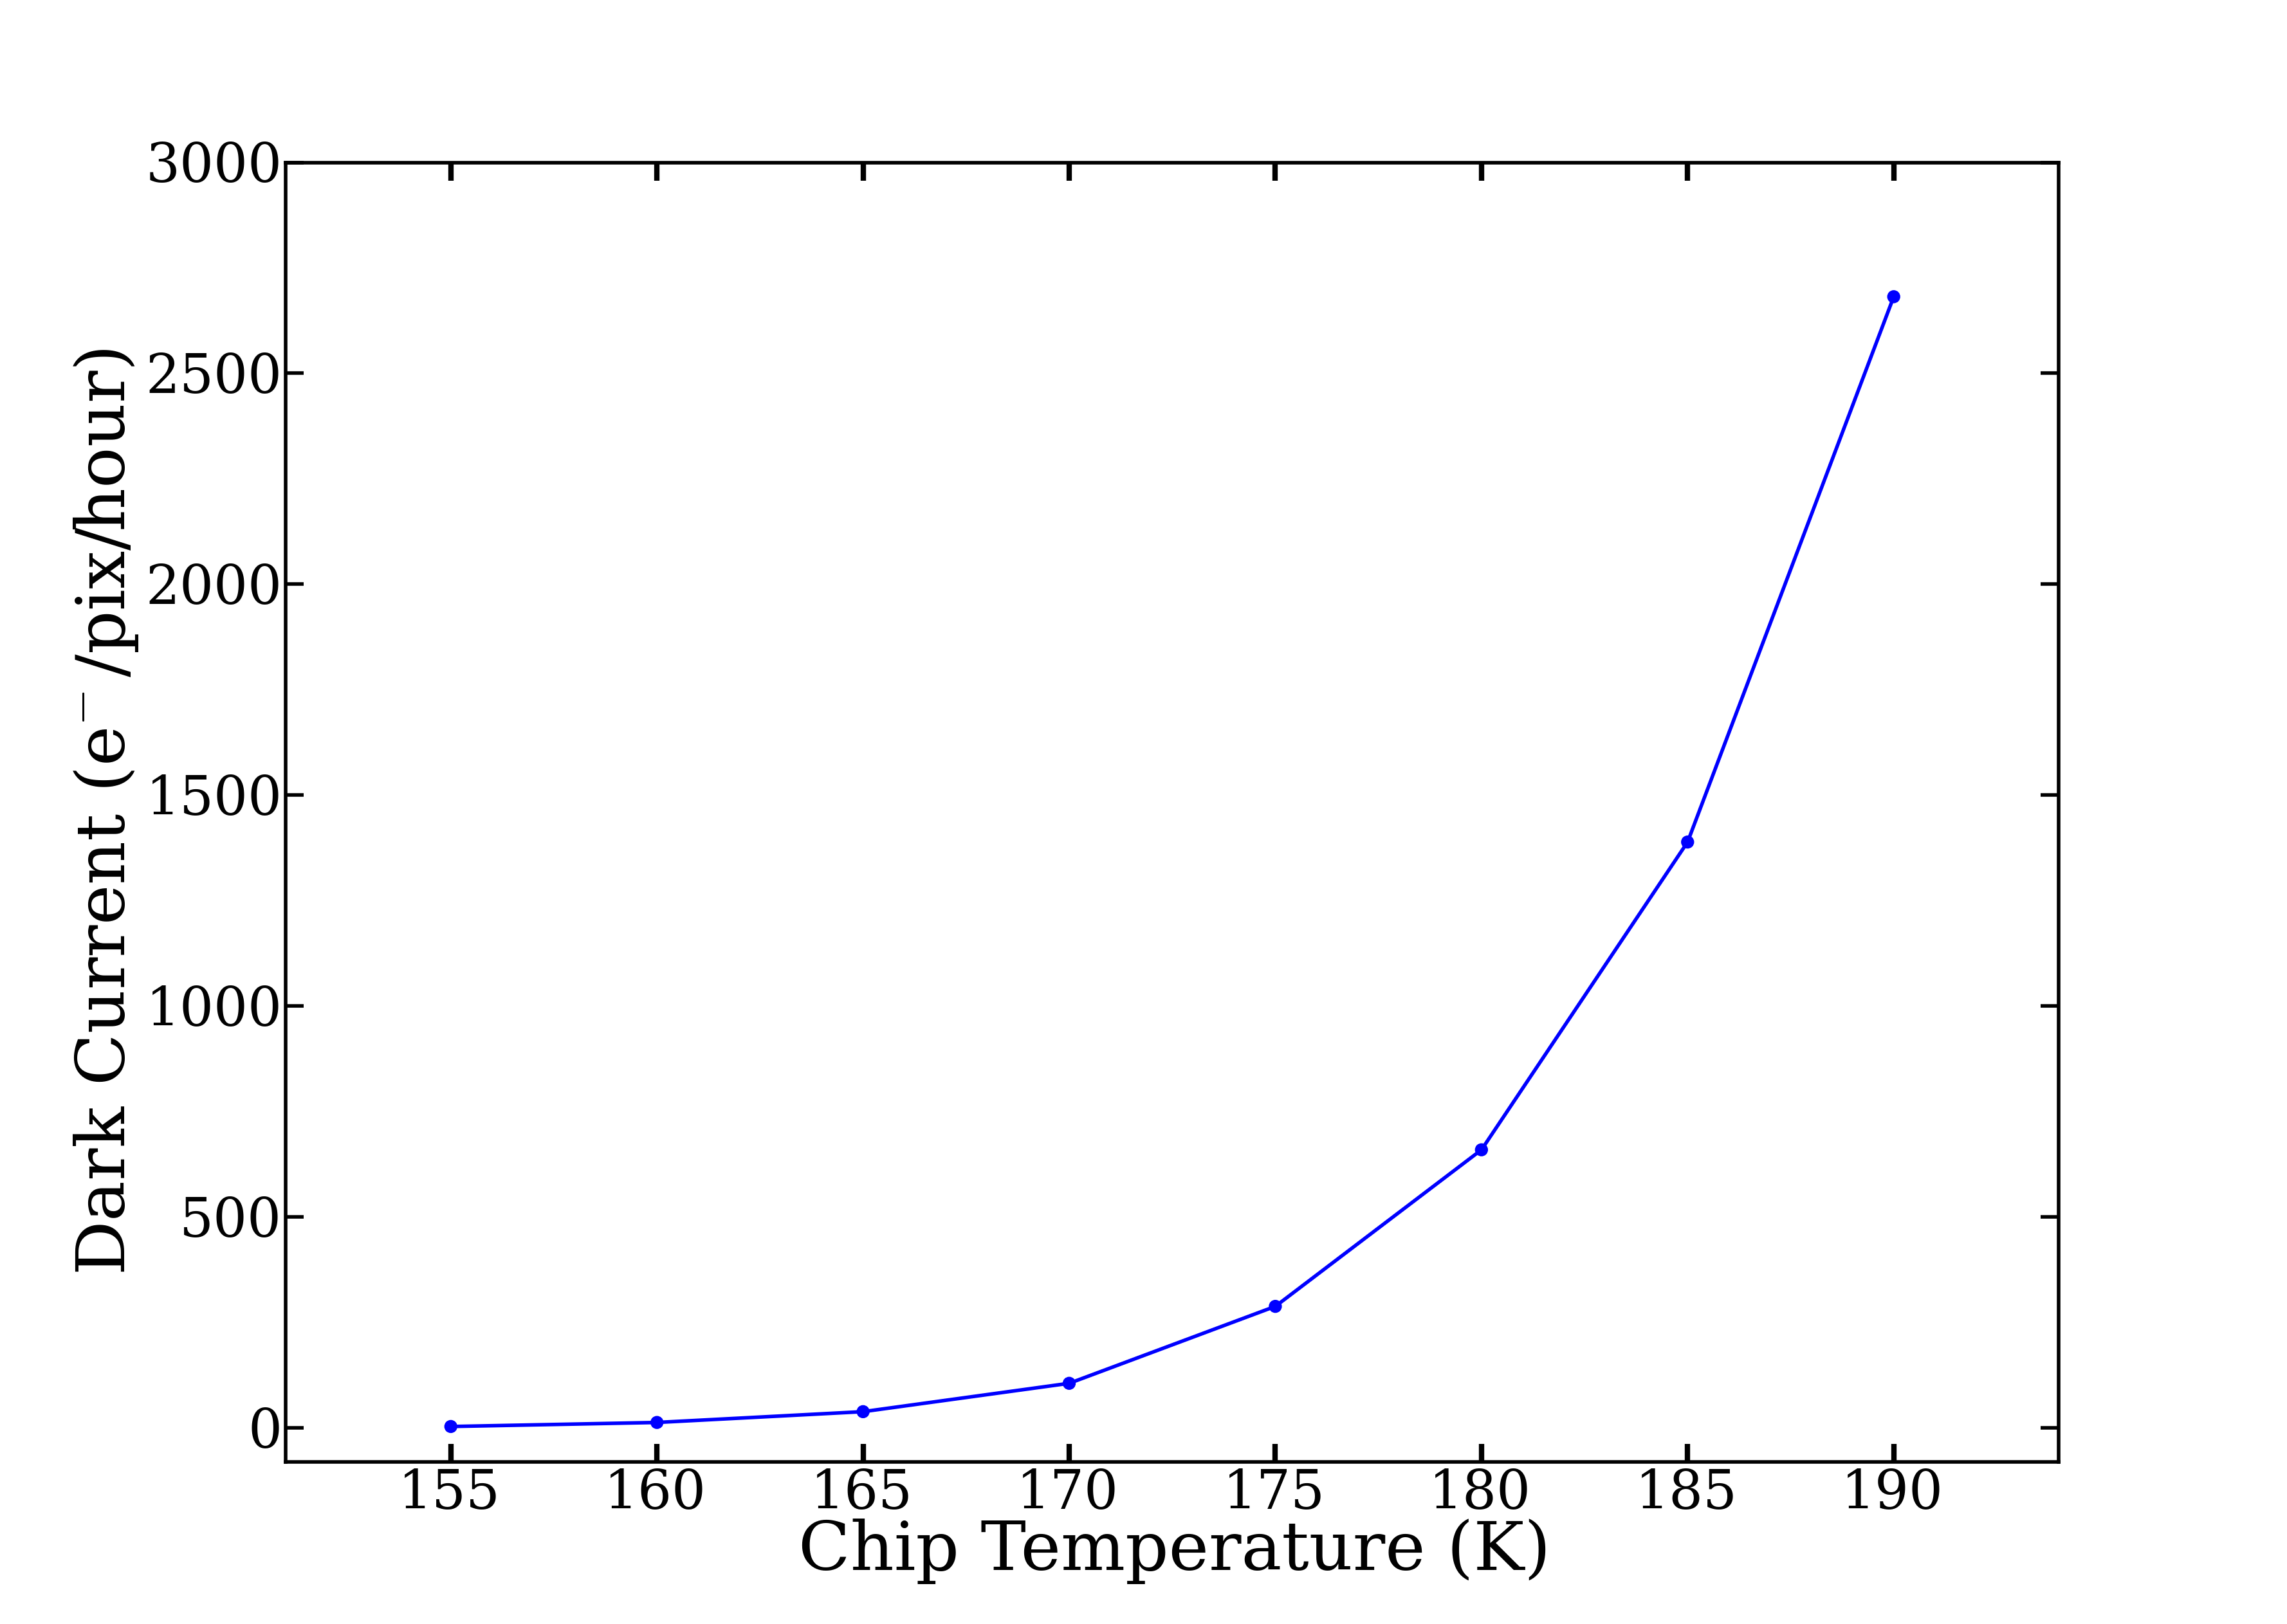
The dependence of dark current on temperature was also investigated. As expected,
the dark current increases with temperature, as follows:
| Temperature (K) | DARK CURRENT (electrons/pix/hr) |
| 155 | 3.2 |
| 160 | 13 |
| 165 | 38 |
| 170 | 106 |
| 175 | 288 |
| 180 | 659 |
| 185 | 1389 |
| 190 | 2682 |
Below is an image of a typical dark frame taken in the lab in Sheffield on 3rd October 2012 with a chip temperature of approximately 160 K. The corresponding ucm file can be downloaded here.
We include links here to example flat field frames taken at the NTT in June 2009 and at the TNT in November 2013. Both png and ucm files are available here. The flats have been bias-subtracted, and a suitable number of individual frames were combined to create each one.