| blazes and grisms |
|
blazes
The fact that diffraction gratings produce multiple spectra, or orders, each with a different dispersion, makes them very versatile but also very inefficient. Most of the light is directed to the zeroth order, which is undispersed and hence useless for spectroscopy. Only ~10% of the light is directed to the first order, which is the most commonly used order in astronomical spectrographs. Some means of directing all of the light into the order of interest would therefore be highly desirable, as illustrated in figure 96.
| figure 96: |
Top: the diffraction pattern produced by a white light source incident
on an unblazed (top) and blazed (bottom) diffraction grating, where
only the orders n = 0, +1, +2, +3 are shown.
Note how the spectra get fainter
as the order increases in the unblazed case, and how most of the light
is directed into the order of interest (n = +1) in the blazed case.
|


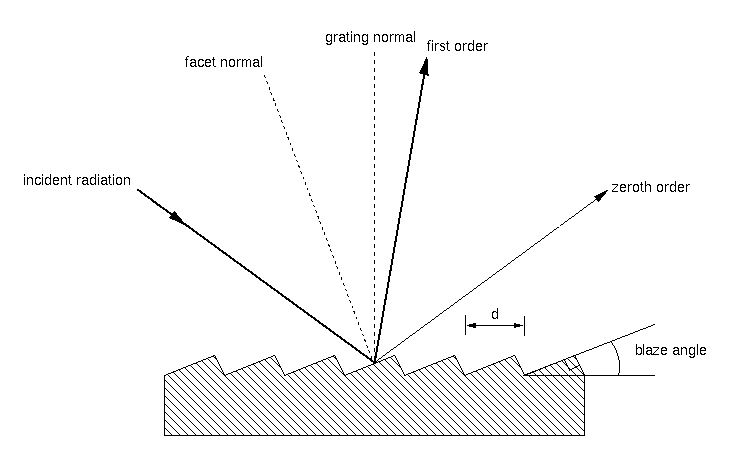
The solution is to employ the fact that gratings are most efficient when the rays emerge from the grating as if by direct reflection. By creating tilted facets, or a blaze, in the grating, as shown in figure 97, it is possible to direct the majority of the light (~70%) into the order of interest.
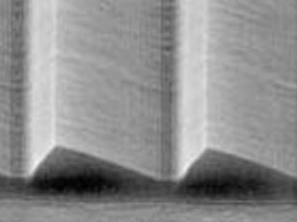
| figure 97: |
Left: a microscopic view of the tilted facets in a typical blazed diffraction grating.
Right: an illustration of the saw-tooth profile of a blazed reflection grating. The tilt of the facet ensures that most of the light is diffracted to the
first order rather than the zeroth order.
|
Having covered gratings, dispersion, resolution and blaze, you should now be able to understand a typical table from a spectrograph user manual, such as that shown in table 3. The first column gives the grating name, where "R" refers to a diamond ruled grating, "H" to a holographic-etched grating, "1200" (for example) to the number of grooves per mm and "B" to the fact that the grating is optimised for blue light. The second column gives the blaze wavelength of the grating in Å, i.e. the wavelength of peak grating efficiency. The third and fourth columns give the dispersion of the grating in units of Å/mm and Å/pixel, where each detector pixel is 13.5 μm in size. The fifth column gives the wavelength range of the resulting spectrum, obtained by multiplying the dispersion in Å/pixel by the number of CCD pixels in the dispersion direction (4096). Only 3500 of these 4096 pixels are usable, so the sixth column lists the usable wavelength range. The final two columns list the slit widths in arcseconds that must be used to obtain a projected slit width at the detector of 54 μm (i.e. 4 pixels) and 27 μm (i.e. 2 pixels). The latter case corresponds to sampling at the Nyquist critical frequency, and the spectral resolution is then given by twice the dispersion. Using a slit which projects to less than 2 pixels will not improve the spectral resolution, as the slit will then be undersampled by the CCD pixels. The 54 μm projected slit width is well matched to the typical seeing on La Palma, resulting in good throughput but oversampling by the CCD pixels; the spectral resolution in this case will then be defined by the slit, not by the pixels.
| table 3: |
Details of the gratings available in the blue arm of the
ISIS spectrograph on the 4.2 m William Herschel Telescope on La Palma.
|
|
ISIS wavelength coverage and resolution with EEV12 |
|||||||
|---|---|---|---|---|---|---|---|
Grating |
Blaze |
Dispersion (Å/mm) |
Dispersion (Å/pix) |
Total Spectral range (Å) |
Unvignetted range (3500 pixels) |
Slit-width for 54 mu at detector (in arcsecs) |
Slit-width for 27 mu at detector (in arcsecs) |
R158B |
3600 |
120 |
1.62 |
6635 |
5670 |
0.8 |
0.4 |
R300B |
4000 |
64 |
0.86 |
3539 |
3024 |
0.8 |
0.4 |
R600B |
3900 |
33 |
0.45 |
1825 |
1560 |
0.9 |
0.45 |
R1200B |
4000 |
17 |
0.23 |
940 |
803 |
1.1 |
0.55 |
H2400B |
Holo |
8 |
0.11 |
442 |
378 |
1.2 |
0.6 |
grisms
removed from course