| photometric systems |
|
In a perfect world, astronomers would not bother with photometry. It would be far better to have spectra of all astronomical sources. That way, the flux of the source would be known at every wavelength, and detailed information on the physical conditions, chemical composition and kinematics of the source could be determined. In practice, however, not enough photons can always be collected to split the light into its component wavelengths with a usable signal-to-noise ratio. Also, for reasons that will become apparent when we discuss spectrographs, it can be difficult to measure accurate absolute fluxes from spectroscopy.
The next best option, then, is to use filters to isolate chunks of the spectrum and take images of sources through these filters. The amount of the spectrum that a filter allows through is known as the bandpass. Filters are usually categorized into narrow-band filters, which have a bandpass of order 10 nm and typically isolate a spectral line, and broad-band filters, which have a bandpass of order 100 nm. The central wavelength of the filter bandpass is known as the effective wavelength. Most modern filters are constructed of different coloured glasses, often in conjunction with thin-film coatings to help define the bandpasses and minimise reflection at the surfaces.
A photometric system (also known as a filter system) consists of a set of filters that provides coarse spectral information about a source. There is a compromise to be made when defining a photometric system - how many filters should there be, and what bandpasses and effective wavelengths should they have? A photometric system with too many filters, each with a very narrow bandpass, would make it difficult to detect sufficient photons from a source, and strong absorption/emission features in the spectrum might adversely affect some of the bandpasses. Conversely, a photometric system with too few filters, each with a very wide bandpass, would provide insufficient spectral information. The best compromise, and most widely used photometric system, is the broad-band UBVRI system shown in the top panel of figure 77. The original three-filter UBV system (which stands for "Ultraviolet", "Blue" and "Visual") was defined by Johnson and Morgan in the early 1950's. In the mid 1960's, Johnson added R and I ("Red" and "Infrared") filters to this system, but these were superseded by the shorter effective-wavelength R and I filters introduced by Cousins in the mid 1970's. Hence the UBVRI filters in use today are commonly referred to as the Johnson-Morgan-Cousins photometric system. The only change to this system since then has been the prescription of the filters: the advent of CCDs, which have completely different spectral sensitivities to the photomultiplier tubes that were used to define the original UBRVI system, led Bessell in 1990 to come up with a new recipe for making UBVRI filters out of common coloured glasses that more closely reproduces the original Johnson-Morgan-Cousins filter profiles when used with CCDs. It is Bessell's UBVRI filters that are found in most of the world's observatories today.
It is standard practice to refer to apparent magnitudes in a particular photometric system by the name of the filter. Hence if the apparent magnitude of a star in the B band is mB = 15.5, this is often referred to simply as B = 15.5. It is also standard practice to refer to the magnitude difference of a star observed through two different filters, the colour index, by the names of the filters. Hence if the apparent magnitudes of a star are B = 15.5 and V = 15.0, then the colour index is B-V = 0.5. The most commonly quoted colour indices in the UBVRI system are U-B, B-V, V-R and R-I.
| figure 77: |
Left: Filter profiles of the Johnson-Morgan-Cousins UBVRI system,
the most widely-used broad-band photometric system in the world. Also plotted
is the transmission of the atmosphere (dotted line) and the quantum
efficiency of a typical CCD (dashed line).
Right:
photograph of UBVRI filters. |
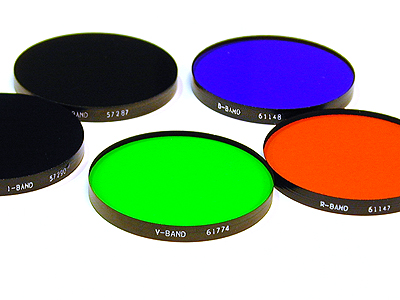
Table 1 lists the key characteristics of the
Johnson-Morgan-Cousins UBVRI photometric system, with values
obtained from Chris Benn's ING
signal program. From left-to-right are tabulated the filter name,
the effective wavelength (λeff), the
bandpass (Δλ; FWHM), the approximate apparent
magnitude of Vega (mVega), the band-averaged
monochromatic fluxes in both frequency (F![]() ) and wavelength (Fλ)
units of a V=0 A0V star, and the photon flux
(Nλ) in units of photons s-1
cm-2 Å-1 (the latter units are used for
convenience as they result in more easily remembered values). Note
than 1 Å = 10-10 m = 0.1 nm. Examples of how to use
the data in table 1 to convert between fluxes
and magnitudes are given in the example problems.
) and wavelength (Fλ)
units of a V=0 A0V star, and the photon flux
(Nλ) in units of photons s-1
cm-2 Å-1 (the latter units are used for
convenience as they result in more easily remembered values). Note
than 1 Å = 10-10 m = 0.1 nm. Examples of how to use
the data in table 1 to convert between fluxes
and magnitudes are given in the example problems.
| table 1: |
characteristics of the Johnson-Morgan-Cousins UBVRI
photometric system. mVega refers to the magnitude
of the star Vega in the filter. Strictly speaking, the magnitude of
Vega is V=0.03 and all colours, e.g. U-B, B-V, etc, are
zero. Magnitudes defined in this way are referred to as being in
the Vega magnitude system. Alternative magnitude systems do
exist, most prominently the AB magnitude system, in which the
V-band magnitude of Vega is still 0.03 but only a star with a
flat spectrum, i.e. F |
| filter | λeff (nm) | Δλ (nm) | mVega | F |
Fλ (W m-2 nm-1) | Nλ (photons s-1 cm-2 Å-1) |
| U | 360 | 50 | 0 | 1.81 x 10⁻²³ | 4.19 x 10⁻¹¹ | 759 |
| B | 430 | 72 | 0 | 4.26 x 10⁻²³ | 6.91 x 10⁻¹¹ | 1496 |
| V | 550 | 86 | 0 | 3.64 x 10⁻²³ | 3.61 x 10⁻¹¹ | 1000 |
| R | 650 | 133 | 0 | 3.08 x 10⁻²³ | 2.19 x 10⁻¹¹ | 717 |
| I | 820 | 140 | 0 | 2.55 x 10⁻²³ | 1.14 x 10⁻¹¹ | 471 |
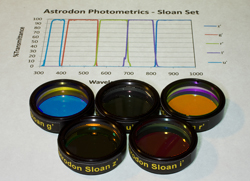
Although widely used, the UBVRI photometric system was not chosen by the Sloan Digital Sky Survey (SDSS), which is one of the most important projects in astronomy today. Instead, they defined a new system: the SDSS photometric system is composed of five filters, u'g'r'i'z', which have broader bandpasses than UBVRI, as shown in figure 78. Their broader bandpasses, in conjunction with their higher transmissions, make u'g'r'i'z' filters superior to UBVRI for photometry of faint sources. Other advantages of the SDSS filters are that there is minimal overlap between the bandpasses, they are not truncated at the red end of the spectrum and hence cover the entire optical range, and each bandpass (apart from the red end of z') is defined by a combination of coloured glass and thin-film coating, making their bandpasses very stable. With 25% of the sky now surveyed, and a catalogue containing u'g'r'i'z' magnitudes for 230 million celestial objects, it is likely that this photometric system will become dominant in the future.
| figure 78: |
Left: Filter profiles of the Sloan Digital Sky Survey (SDSS)
u'g'r'i'z' system.
Also plotted
is the transmission of the atmosphere (dotted line) and the quantum
efficiency of a typical CCD (dashed line).
Right: photograph of u'g'r'i'z' filters. |